---
title: "Application Specific Metrics with Express Gateway"
description: "Express Gateway is an API gateway that sits at the heart of any microservices architecture, securing your microservices and exposing them through APIs."
authors:
- name: "Vincenzo Chianese"
url: "https://auth0.com/blog/authors/vincenzo-chianese/"
date: "Mar 26, 2018"
category: "Developers,Deep Dive,Express Gateway"
tags: ["javascript", "nodejs", "authentication", "auth", "api", "rest", "apigateway"]
url: "https://auth0.com/blog/application-metrics-with-express-gateway/"
---
# Application Specific Metrics with Express Gateway
**TL;DR:** In this tutorial, I'll show you how an API gateway can collect application specific metrics for you.
You can get [the code example in this GitHub repository](https://github.com/XVincentX/express-gateway-prometheus-metrics-example).
---
## Introduction
Unless you're building a proof of concept or an application that's not aiming to reach production, you definitely want to add **monitoring** and **metrics** to your system. In this installment, we're going to look how **Express Gateway** can help you to add application specific metrics and expose them through an HTTP endpoint that can be queried by an external service, such as [Prometheus][prometheus-homepage].
## Express Gateway to Rescue
Express Gateway is an API gateway that sits at the heart of any microservices architecture (regardless of what language or platform is being used), **securing** the different pieces and exposing them through **APIs**. All these magic works by using [Node.js](https://nodejs.org), [ExpressJS](https://expressjs.com/), and [Express middleware](https://expressjs.com/en/guide/writing-middleware.html).
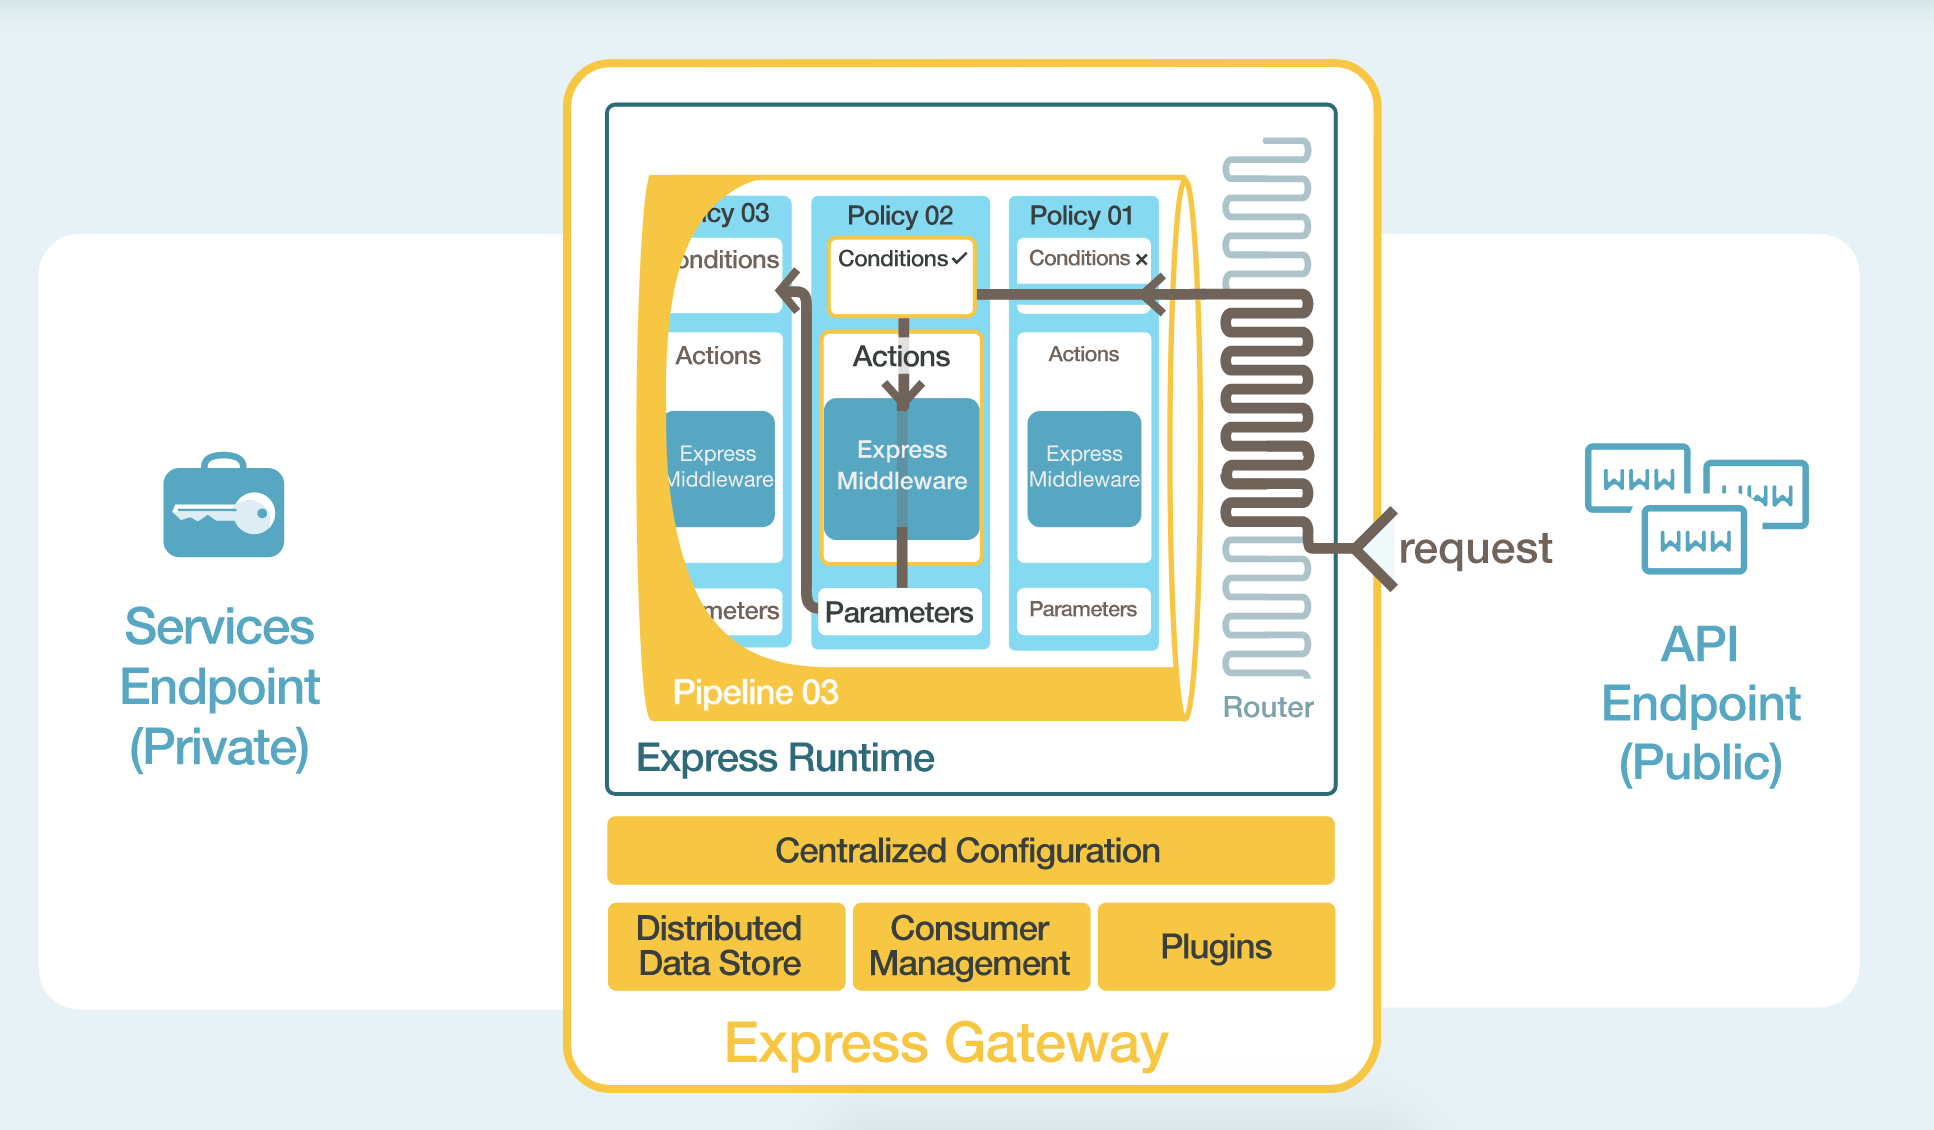
Express Gateway centralizes all the application configuration for the API use case into one YAML (or JSON) file. Within the YAML file there is an easy to understand description of what is configured and how.
Express Gateway entities, like _policies_, _pipelines_, _conditions_, and _actions_ wrap around Express middleware to make it **dynamic**. Any Express middleware can be plugged into Express Gateway to take advantage of its dynamic capabilities. It also features a hot-reload mechanism so you can change its configuration without having to restart the gateway at all.
## Writing a Plugin for Express Gateway
Express Gateway comes with a plugin framework used to extend the Express Gateway core.
The plugin framework enables anyone to take **Express middleware** and integrate them into Express Gateway as plugins. Express Gateway provides a declarative way to take advantage of Express middleware to be driven centrally and executed dynamically.
We're going to leverage such framework in order to build a plugin that'll hook in our HTTP responses and collect the information we need.
### Scaffold a Plugin
A plugin is nothing more than a JavaScript object that you export. It's shape is described in detail [in the documentation][plugin-shape]
```javascript
module.exports = {
init: function (pluginContext) {
},
}
```
In our case, we will create a plugin that:
1. Exposes a policy that will hook in the [response][express-response], collecting information in
[Prometheus format][prometheus-format].
2. Extend the [Admin API][admin-api] to expose an additional endpoint that will serve all the collected information.
#### What Metrics Are We Going to Collect?
There are a lot of ways to slice and dice metrics. They may vary according to your needs.
In this example, we will label all the responses that are on the way to the client according to:
* Success/Failed responses (discerned on the status code).
* The status code itself.
* The consumer id (if the request is authenticated).
* The [API Endpoint][apiendpoint] that triggered the Gateway.
#### What format do we expose the metrics?
To leverage the existing tooling around, we will expose the collected metrics in the [Prometheus Text Based Wire Format][prometheus-format]. In this way, we can **leverage the tools** that are already on the space to push and visualize the information, such as [Grafana][grafana].
```javascript
const metrics = require('prom-client');
const statusCodeCounter = new metrics.Counter({
name: 'status_codes',
help: 'status_code_counter',
labelNames: ['type', 'status_code', 'consumer', 'apiendpoint']
});
module.exports = {
version: '1.0.0',
policies: ['metrics'],
init: (pluginContext) => {
pluginContext.registerAdminRoute((app) => {
app.get(pluginContext.settings.endpointName, (req, res) => {
if (req.accepts(metrics.register.contentType)) {
res.contentType(metrics.register.contentType);
return res.send(metrics.register.metrics());
}
return res.json(metrics.register.getMetricsAsJSON());
});
});
pluginContext.registerPolicy({
name: 'metrics',
policy: ({ consumerIdHeaderName }) => (req, res, next) => {
res.once('finish', () => {
const apiEndpoint = req.egContext.apiEndpoint.apiEndpointName;
const consumerHeader = req.header(consumerIdHeaderName) || 'anonymous';
const statusCode = res.statusCode.toString();
const responseType = res.statusCode >= 200 && res.statusCode < 300 ? 'SUCCESS' : 'FAILED';
statusCodeCounter.labels(responseType, statusCode, consumerHeader, apiEndpoint).inc();
});
next();
}
});
}
};
```
Let's go through the code and see the relevant parts:
```javascript
const statusCodeCounter = new metrics.Counter({
name: 'status_codes',
help: 'status_code_counter',
labelNames: ['type', 'status_code', 'consumer', 'apiendpoint']
});
```
Here we're declaring a new Prometheus Counter called `status_code` that will track all the responses and categorize
them based on the declared labels (`['type', 'status_code', 'consumer', 'apiendpoint']`):
```javascript
pluginContext.registerAdminRoute((app) => {
app.get(pluginContext.settings.endpointName, (req, res) => {
if (req.accepts(metrics.register.contentType)) {
res.contentType(metrics.register.contentType);
return res.send(metrics.register.metrics());
}
return res.json(metrics.register.getMetricsAsJSON());
});
});
```
This part of code is registering a new [route][admin-route-plugin] that will expose all the collected metrics. According to the `Accept` header, we're either returning the data in Prometheus format as JSON or in text format. The external tool collecting the data (such as InfluxDB or a Prometheus server) will query this endpoint **periodically** to grab the latest updates.
*Note:* Prometheus also supports [data pushing](https://prometheus.io/docs/instrumenting/pushing/) instead of polling it periodically. If you go in this way, you can **avoid to expose an endpoint** at all. Based on your requirements (such as security) you may opt for this other option.
```javascript
pluginContext.registerPolicy({
name: 'metrics',
policy: ({ consumerIdHeaderName }) => (req, res, next) => {
res.once('finish', () => {
const apiEndpoint = req.egContext.apiEndpoint.apiEndpointName;
const consumerHeader = req.header(consumerIdHeaderName) || 'anonymous';
const statusCode = res.statusCode.toString();
const responseType = res.statusCode >= 200 && res.statusCode < 300 ? 'SUCCESS' : 'FAILED';
statusCodeCounter.labels(responseType, statusCode, consumerHeader, apiEndpoint).inc();
});
next();
}
});
```
Then, we export a new policy that will register an event handler once the response is terminated. Here we can now **inspect** all the response as well as request details that will populate our labels.
*Note:* [`egContext`][egcontext] is an Express Gateway specific object that contains additional information on the request that's being handled.
## Put it in production
We have our plugin ready to be used. Now we have to install it in our Gateway and enabled it.
Express Gateway plugins are nothing more than **NPM packages**, so we can simply publish our package to the registry and then install it using the command line.
For this tutorial, I've already published a plugin called `express-gateway-prometheus-metrics-example` with the exact same code we saw above. Hence, we can install the plugin directly by simply typing `eg plugins install express-gateway-prometheus-metrics-example`
*Note:* Express Gateway can also load [plugins inline][inline-load]. This is useful when you want to test them before publishing them. In this case, you could point the `package` property to our `index.js` file.
Now let's modify our [`gateway.config`][gateway-config] and configure a policy that will take advantage of such policy:
```yaml
http:
port: 8080
admin:
port: 9876
apiEndpoints:
api:
host: '*'
serviceEndpoints:
httpbin:
url: 'http://httpbin.org'
policies:
- proxy
- metrics
pipelines:
- name: basic
apiEndpoints:
- api
policies:
- metrics:
- proxy:
- action:
serviceEndpoint: httpbin
changeOrigin: true
```
## See it live
Let's spin up the gateway and throw some requests to it:
```bash
$ ab -n 20 http://localhost:8080/
```
Once the command is terminated, we can now query our metrics endpoint to see what happened with such requests:
```bash
$ curl http://localhost:9876/metrics
# HELP status_codes status_code_counter
# TYPE status_codes counter
status_codes{type="FAILED",status_code="502",consumer="anonymous",apiendpoint="api"} 15
status_codes{type="SUCCESS",status_code="200",consumer="anonymous",apiendpoint="api"} 5
```
You can see we received back the Prometheus metrics with all the data we collected.
## Byproduct — Use JSON Schema to validate your parameters
Express Gateway relies on **JSON Schemas** to make sure all the configurations that goes in its funnel it's correct.
You can leverage the same mechanism to specify the **required** parameters, good defaults and **validation** rules for your plugin.
In our case, for instance, it's pretty clear that the Admin API path where the metrics will be exposed is **mandatory**; also we might want to configure the header where the consumer id information is stored.
With these two requirements in mind, we can write something like this:
```javascript
module.exports = {
version: '1.0.0',
policies: ['metrics'],
schema: {
$id: 'http://express-gateway.io/plugins/metrics.json',
type: 'object',
properties: {
endpointName: {
type: 'string',
default: '/metrics'
}
}, required: ['endpointName']
},
init: function (pluginContext) {
pluginContext.registerAdminRoute((app) => {
// admin route code
});
pluginContext.registerPolicy({
name: 'metrics',
schema: {
$id: 'http://express-gateway.io/policies/metrics.json',
type: 'object',
properties: {
consumerIdHeaderName: {
type: 'string',
default: 'eg-consumer-id'
}
}, required: ['consumerIdHeaderName']
},
policy: ({ consumerIdHeaderName }) => (req, res, next) => {
// policy code
}
});
}
};
```
Thanks to this small addition, the gateway will **validate** the provided parameters against the schema and will
refuse to load the plugin if the validation does not pass.
## Conclusions
Metrics are **hard**. In a Microservices context, it's even **harder**. In this installment we discovered how to leverage the shared **middleware** (our API gateway) to collect data **without** having to modify the services' code at all, and have a **centralized** way to push and display these.
[plugin-shape]: https://www.express-gateway.io/docs/plugins/plugin-development/
[express-response]: http://expressjs.com/en/4x/api.html#res
[admin-api]: https://www.express-gateway.io/docs/admin/#markdown
[apiendpoint]: https://www.express-gateway.io/docs/configuration/gateway.config.yml/apiEndpoints/#markdown
[prometheus-format]: https://github.com/prometheus/docs/blob/master/content/docs/instrumenting/exposition_formats.md
[grafana]: https://grafana.com/plugins?type=datasource
[admin-route-plugin]: https://www.express-gateway.io/docs/plugins/route-development/#exporting-admin-routes-to-plugin
[egcontext]: https://www.express-gateway.io/docs/policies/customization/eg-context/
[inline-load]: https://github.com/XVincentX/express-gateway-prometheus-metrics-example/blob/master/gateway/config/system.config.yml#L9
[gateway-config]: https://www.express-gateway.io/docs/configuration/gateway.config.yml/
[prometheus-homepage]: https://prometheus.io/