


TL;DR: Logs are the most critical way for debugging. They can help us follow the different operations carried out by the various services of our system.
This article will demonstrate how to integrate ELK Stack with a Spring Boot application for logs aggregation and monitoring in a centralized and scalable way. You will also learn how to create custom index patterns through a Filebeat configuration and separate logs of different services of the same application by different indexes. The application's source code used in this tutorial is available in this GitHub repository.
Introduction
Having a good log monitoring infrastructure is a key feature to have while developing any software. For instance, in a microservices architecture, any single operation triggers a chain of API calls making it challenging to debug the entire application in case an error comes.
This is where Logs act as essential information that allows us to investigate better and diagnose the errors. They can help sysadmins, support teams, and even developers to follow the different operations carried out by the different services of the system.
But it becomes very complex to maintain this critical data in a distributed environment where many applications, services, and systems are running. As a solution for this problem, we're going to look at the ELK stack, a useful tool for centralized log aggregation and analysis.
This article will demonstrate how you can integrate ELK Stack with a Spring Boot application to collect, process, store, and view the logs.
Apart from this, while working with the ELK stack, the default action is to show all the logs of a particular application at a single place inside Kibana.
In this article, you will also tackle this problem and learn how you can view the logs of multiple services separately that are running in parallel inside one single application.
Introducing ELK Stack
ELK is a collection of three open-source applications - Elasticsearch, Logstash, and Kibana from Elastic that accepts data from any source or format, on which you can then perform search, analysis, and visualize that data.
- Elasticsearch — Elasticsearch stores and indexes the data. It is a NoSQL database based on Lucene's open-source search engine. Since Elasticsearch is developed using Java, therefore, it can run on different platforms. One particular aspect where it excels is indexing streams of data such as logs.
- Logstash — Logstash is a tool that integrates with a variety of deployments. It is used to collect, parse, transform, and buffer data from a variety of sources. The data collected by Logstash can be shipped to one or more targets like Elasticsearch.
- Kibana — Kibana acts as an analytics and visualization layer on top of Elasticsearch. Kibana can be used to search, view, and interpret the data stored in Elasticsearch.
ELK Installation & Other Configurations
Now that you understand what ELK means, let's learn how to configure all three components to your local development environment:
Elasticsearch
Download the Elasticsearch zip file from the official elastic website and extract the zip file contents.
Next, you can start the Elasticsearch cluster by running bin/elasticsearch on Linux and macOS or bin\elasticsearch.bat on Windows.
To make sure the Elasticsearch cluster is up and working fine, open the browser at http://localhost:9200. You must see something similar to this:
{
  "name" : "YOUR_PC_NAME",
  "cluster_name" : "elasticsearch",
  "cluster_uuid" : "Qz59cUdbQRuRTVct1h3HiA",
  "version" : {
    "number" : "7.13.2",
    "build_flavor" : "default",
    "build_type" : "zip",
    "build_hash" : "4d960a0733be83dd2543ca018aa4ddc42e956800",
    "build_date" : "2021-06-10T21:01:55.251515791Z",
    "build_snapshot" : false,
    "lucene_version" : "8.8.2",
    "minimum_wire_compatibility_version" : "6.8.0",
    "minimum_index_compatibility_version" : "6.0.0-beta1"
  },
  "tagline": "You Know, for Search."
}
Kibana
Setting up Kibana is similar to Elasticsearch. Just download the latest version application from the official website.
To start Kibana, run bin/kibana on Linux and macOS or bin/kibana.bat on Windows.
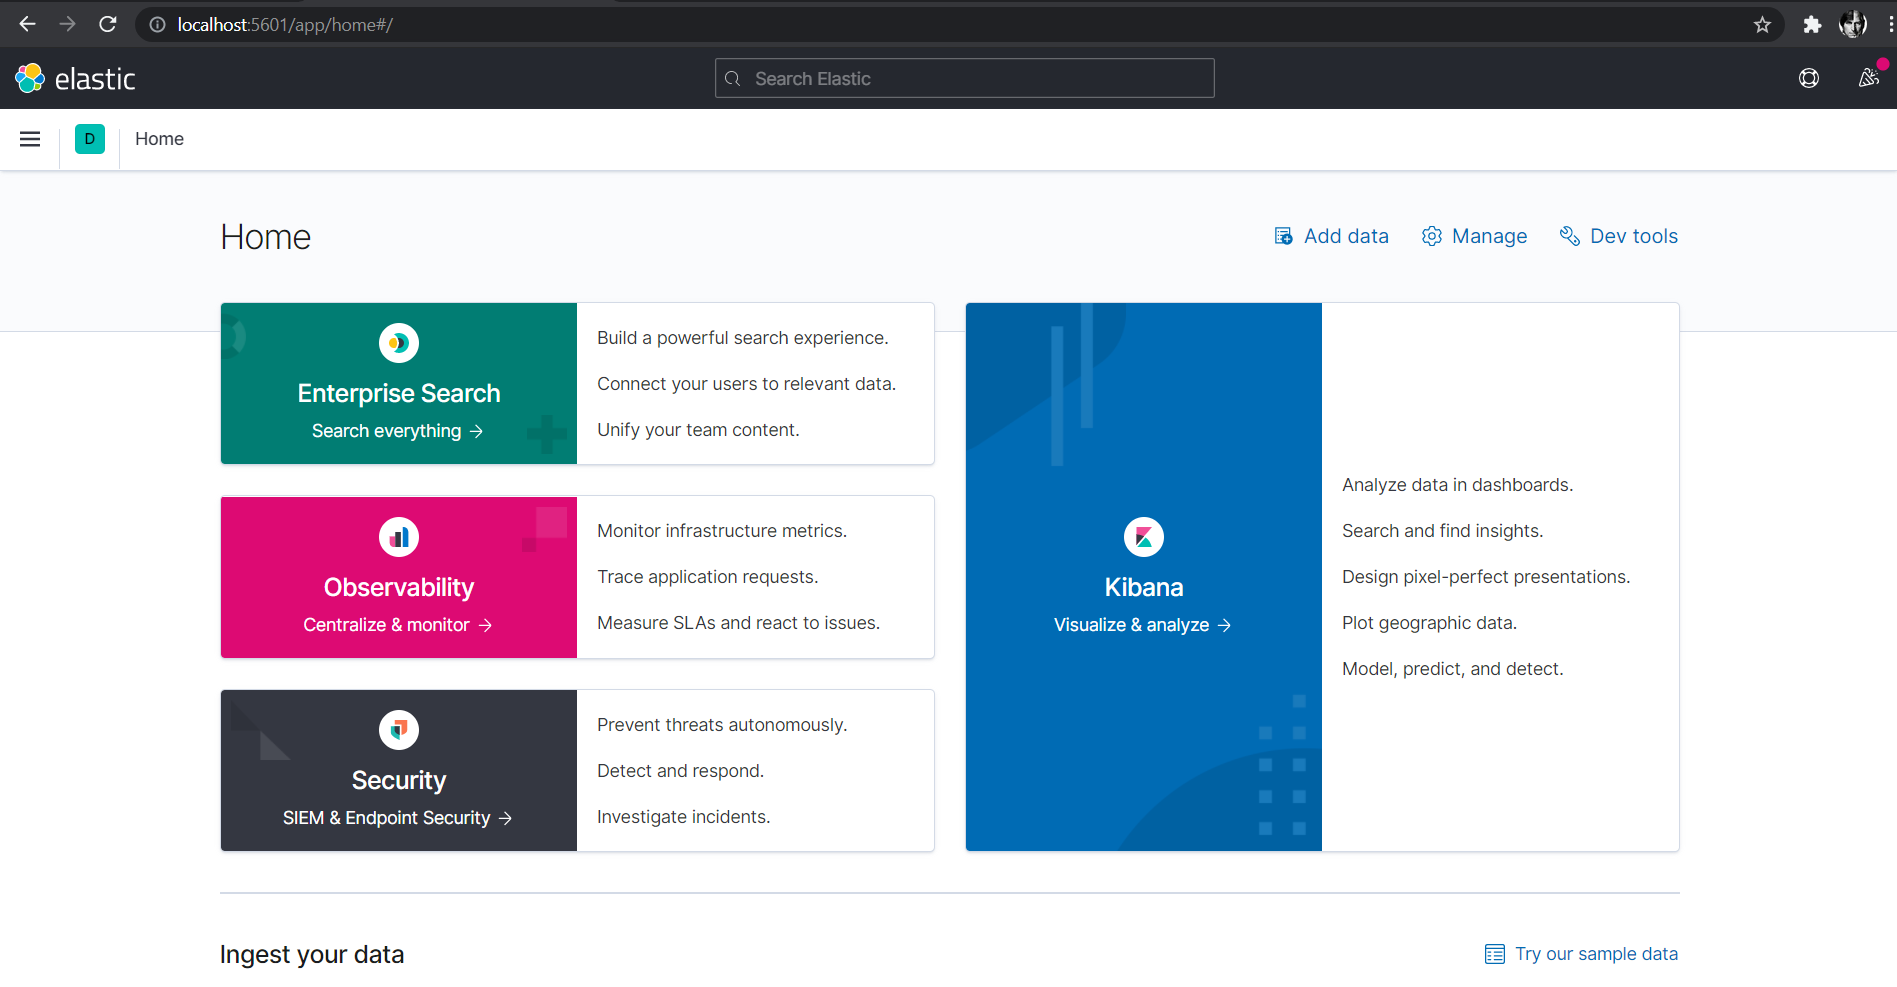
By default, Kibana listens on port 5601. If you go to http://localhost:5601, you should be redirected to the Kibana home page:
Logstash
Download and extract the latest version of Logstash from official Logstash downloads
Here, inside the bin folder, you need to create one configuration(.conf) file. For instance, in this case, you will be creating logstash.conf.
A Logstash configuration consists of 3 components:
1. Input
The input section in the configuration file defines the name and the absolute path of the file from where data has to be fetched. In your case, it will be from the log file generated by the spring boot application.
2. Filter
The filter section defines what processing you want to apply to the data.
3. Output
The output section defines the target where you want to send the data (elasticsearch, for example).
So your logstash.conf file should look similar to this:
input {

}

filter {

}
output {

}
In the further section, you will be making the changes in this file to pass the Spring Boot application logs to elasticsearch.
To run the logstash configuration file, use command:
logstash -f <file>.conf
Apart from these, the other prerequisites required to follow this tutorial are:
- Java 11 or later version
- Apache Maven
- Postman App
Also, this tutorial requires you have a basic understanding of how REST APIs work in Spring Boot.
Creating a Spring Boot Application
Let's now begin with creating the microservice. You will be using Spring Boot to create the REST APIs, and then you'll integrate it with the ELK stack that you saw above.
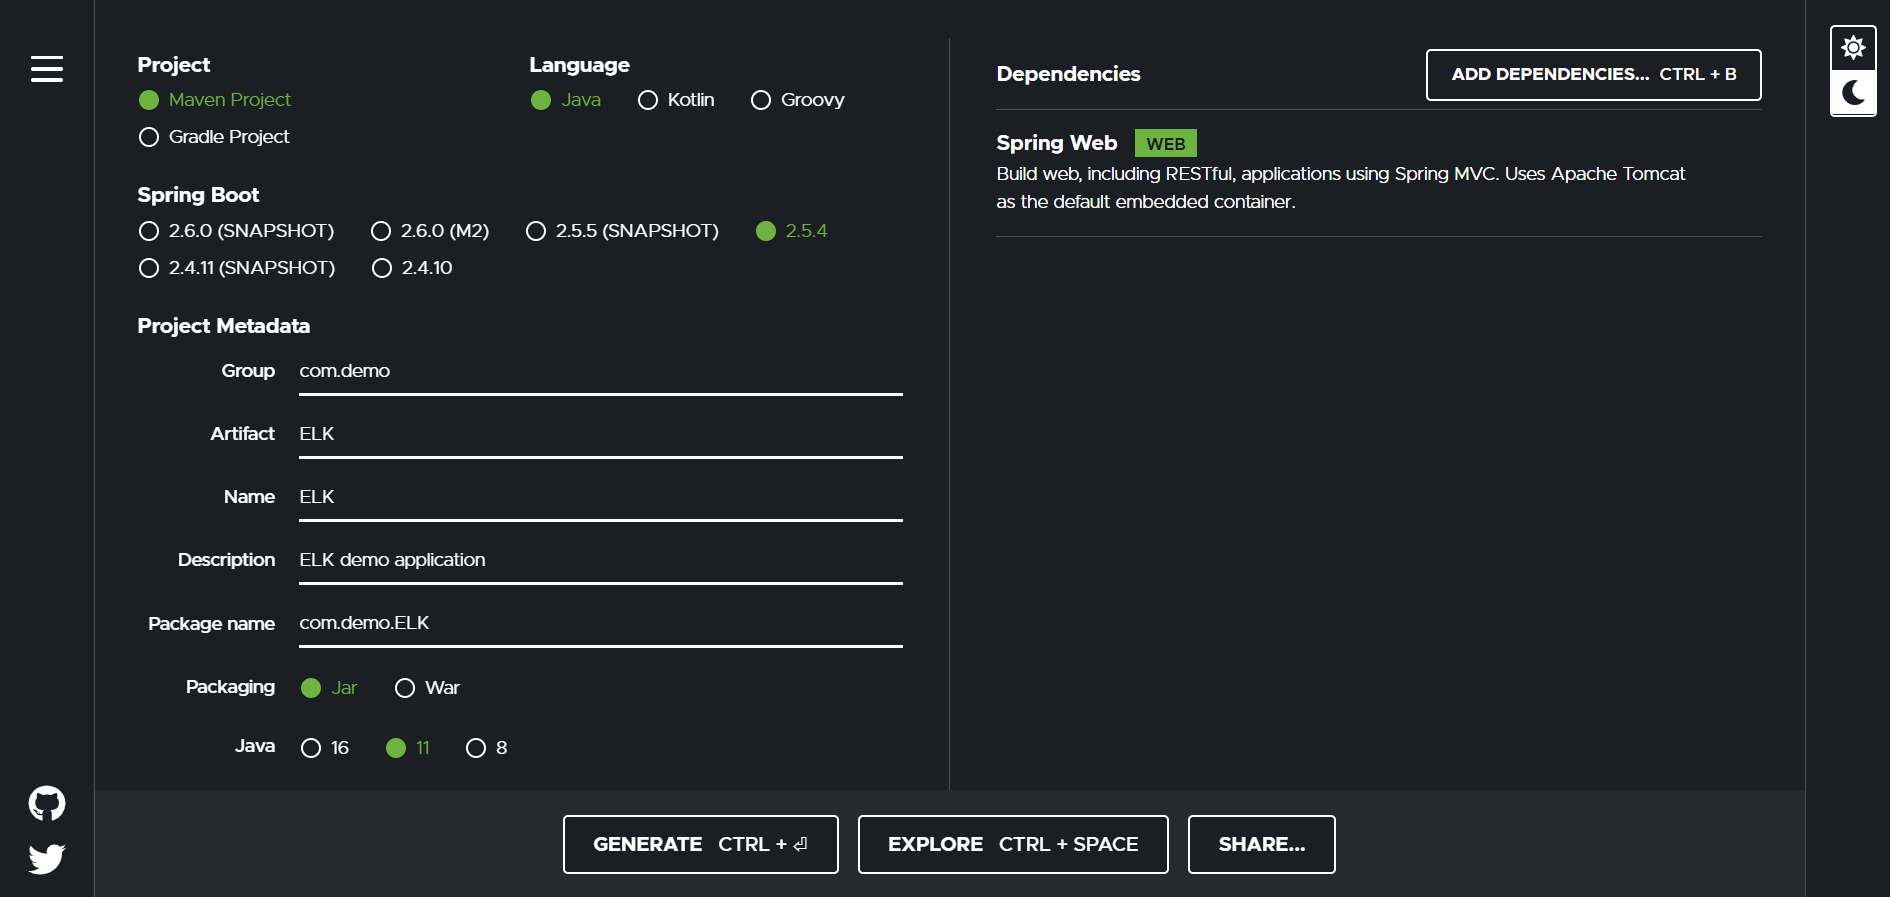
To start with Spring Boot, you can create a basic project using the Spring Boot Initializr.
Select Maven project and Java language. For the Spring Boot version, select 2.5.4. You will also have to add the spring-boot-starter-web dependency.
Next, fill in the project metadata. Set group as com.demo, artifact and name as ELK, package as com.demo.ELK. Last but not least, enter a short description and click the generate button.
Open the project folder in your favorite IDE and open the pom.xml file.
Add the following code to the pom.xml to configure the extra dependencies that you are going to use in this Spring Boot project:
<?xml version="1.0" encoding="UTF-8"?>
<project xmlns="http://maven.apache.org/POM/4.0.0" xmlns:xsi="http://www.w3.org/2001/XMLSchema-instance"
    xsi:schemaLocation="http://maven.apache.org/POM/4.0.0 https://maven.apache.org/xsd/maven-4.0.0.xsd">
    <modelVersion>4.0.0</modelVersion>
    <parent>
        <groupId>org.springframework.boot</groupId>
        <artifactId>spring-boot-starter-parent</artifactId>
        <version>2.5.3</version>
        <relativePath/> <!-- lookup parent from repository -->
    </parent>
    <groupId>com.demo</groupId>
    <artifactId>ELK</artifactId>
    <version>0.0.1-SNAPSHOT</version>
    <name>ELK</name>
    <description>Logs monitoring and aggregation using ELK stack</description>
    <properties>
        <java.version>11</java.version>
    </properties>
    <dependencies>
        <dependency>
            <groupId>org.springframework.boot</groupId>
            <artifactId>spring-boot-starter-web</artifactId>
        </dependency>
        <dependency>
            <groupId>org.springframework.boot</groupId>
            <artifactId>spring-boot-starter-test</artifactId>
            <scope>test</scope>
        </dependency>
        <dependency>
            <groupId>org.json</groupId>
            <artifactId>json</artifactId>
            <version>20180130</version>
        </dependency>
        <dependency>
            <groupId>com.googlecode.json-simple</groupId>
            <artifactId>json-simple</artifactId>
            <version>1.1</version>
        </dependency>
    </dependencies>
    <build>
        <plugins>
            <plugin>
                <groupId>org.springframework.boot</groupId>
                <artifactId>spring-boot-maven-plugin</artifactId>
            </plugin>
        </plugins>
    </build>
</project>
Next, create a new package com.demo.ELK.controller. Inside this, make a new Java file called ELKController.java to define the REST Controller for exposing the API endpoints.
You will call these APIs to print the content to your log file.
package com.demo.ELK.controller;

import com.fasterxml.jackson.databind.JsonNode;
import org.json.simple.JSONArray;
import org.slf4j.Logger;
import org.slf4j.LoggerFactory;
import org.springframework.beans.factory.annotation.Autowired;
import org.springframework.web.bind.annotation.GetMapping;
import org.springframework.web.bind.annotation.PathVariable;
import org.springframework.web.bind.annotation.RequestMapping;
import org.springframework.web.bind.annotation.RestController;

import java.util.Date;

@RestController
@RequestMapping(value = "/api")
public class ELKController {

    // Initializing instance of Logger for Controller
    private static final Logger log = LoggerFactory.getLogger(ELKController.class);

    private final ELKService service;

    private final RestService restService;

    public ELKController(ELKService service, RestService restService) {
        this.service = service;
        this.restService = restService;
    }

    @GetMapping(value = "/hello")
    public String helloWorld() {
        log.info("Inside Hello World Function");
        String response = "Hello World! " + new Date();
        log.info("Response => {}",response);
        return response;
    }

    @GetMapping(value = "/Food-Details")
    public JSONArray foodDetails() {
        log.info("Inside Food Detail Function");
        return service.getAllFoodDetails();
    }
}
Here you are exposing two endpoints which are:
/api/hello— It returns the "Hello World!" message with the current timestamp./api/Food-Details— It gives the details of some food data, which is stored inside a JSON file.
The ELKService class for that is as follows:
package com.demo.ELK.services;

import org.json.simple.JSONArray;
import org.json.simple.JSONObject;
import org.json.simple.parser.JSONParser;
import org.json.simple.parser.ParseException;
import org.slf4j.Logger;
import org.slf4j.LoggerFactory;
import org.springframework.stereotype.Service;

import java.io.FileReader;
import java.io.IOException;
import java.nio.charset.StandardCharsets;

@Service
public class ELKService {

    // Initializing instance of Logger for Service
    private static final Logger log = LoggerFactory.getLogger(ELKService.class);

    public JSONArray getAllFoodDetails(){
        log.info("Fetching ALL food details...");
        JSONArray foodDetail = new JSONArray();
        try {
            JSONParser parser = new JSONParser();
            Object obj = parser.parse(new FileReader("example.json", StandardCharsets.UTF_8));
            JSONObject jsonObject = (JSONObject) obj;
            foodDetail = (JSONArray) jsonObject.get("data");

        } catch (IOException | ParseException e) {
            log.error("Error occurred in reading JSON file");
            e.printStackTrace();
        }
        return foodDetail;
    }
}
And following is the content inside the example.json file which you are reading:
{
    "data": [

        {
            "id": 0,
            "productName": "Fresh Avocados",
            "image": "🥑",
            "from": "Spain",
            "nutrients": "Vitamin B, Vitamin K",
            "quantity": "4 🥑",
            "price": "6.50",
            "organic": true,
            "description": "A ripe avocado yields to gentle pressure when held in the palm and squeezed. "
        },
        {
            "id": 1,
            "productName": "Cheese",
            "image": "🧀",
            "from": "Portugal",
            "nutrients": "Vitamin A, Calcium",
            "quantity": "250g",
            "price": "5.00",
            "organic": false,
            "description": "Creamy and distinct in flavor, goat cheese is a dairy product enjoyed around the world."
        },
        {
            "id": 2,
            "productName": "Broccoli",
            "image": "🥦",
            "from": "Portugal",
            "nutrients": "Vitamin C, Vitamin K",
            "quantity": "3 🥦",
            "price": "5.50",
            "organic": true,
            "description": "Broccoli is known to be a hearty and tasty vegetable which is rich in dozens of nutrients."
        }
    ]
}
Creating Logback-Spring.xml
Next, you also have to configure the logback-spring.xml file inside the resources folder of your project. It will be responsible for printing the logs in the console and to a log file. Logstash will use this log file to feed the data to Elasticsearch.
<?xml version="1.0" encoding="UTF-8"?>
<configuration>
    <appender name="STDOUT" class="ch.qos.logback.core.ConsoleAppender">
        <encoder>
            <pattern> %d{dd-MM-yyyy HH:mm:ss.SSS} [%thread] %-5level %logger{36}.%M - %msg%n </pattern>
        </encoder>
    </appender>
    <appender name="SAVE-TO-FILE" class="ch.qos.logback.core.FileAppender">
        <file>logs/application.log</file>
        <encoder class="ch.qos.logback.classic.encoder.PatternLayoutEncoder">
            <Pattern> %d{dd-MM-yyyy HH:mm:ss.SSS} [%thread] %-5level %logger{36}.%M - %msg%n </Pattern>
        </encoder>
    <logger name="com.demo.ELK" additivity="false" level="info">
        <appender-ref ref="SAVE-TO-FILE" />
        <appender-ref ref="STDOUT" />
    </logger>
    <root level="INFO">
        <appender-ref ref="STDOUT" />
    </root>
</configuration>
Loggers are responsible for capturing events and passing them to the appender. Appenders (also known as Handlers in some logging frameworks) are responsible for documenting the log events to a destination.
Here inside appenders, you have defined a custom log pattern - %d{dd-MM-yyyy HH:mm:ss.SSS} [%thread] %-5level %logger{36}.%M - %msg%n. Let us first understand what each of these terms means:
- %d – Returns the time when the log message occurred.
- %thread – Returns the name of the thread in which the log message occurred.
- %-5level – Returns the logging level of the log message (ERROR, WARN, INFO, DEBUG, and TRACE).
- %logger{64} – Returns the package with the package and class name where the log message occurred. The number 64 inside the brackets represents the maximum length of the package and class name combined. You can change this number as per your need.
- %M – Returns the name of the method where the log message has occurred.
- %msg – Returns the actual log message.
- %n – Line break.
You have added two appenders here, one for logging in to the console and another one to log to a file.
With that covered, let's see how you can start your Spring Boot app server using CLI:
- Since you are using Maven, run the
mvn clean installcommand in a terminal window inside your project root directory. This creates a JAR(Java archive) file that contains a compressed version of .class files, audio files, image files, or other directories. - This JAR will be created inside the
targetfolder in the root directory. Navigate to that directory and runjava -jar <JAR_NAME>.jar <MAIN_CLASS_NAME>. For example - java -jar ELK-0.0.1-SNAPSHOT.jar com.demo.ELK.ElkApplication
This will start your Spring Boot application on the default 8080 port:
  .   ____          _            __ _ _
 /\\ / ___'_ __ _ _(_)_ __  __ _ \ \ \ \
( ( )\___ | '_ | '_| | '_ \/ _` | \ \ \ \
 \\/  ___)| |_)| | | | | || (_| |  ) ) ) )
  '  |____| .__|_| |_|_| |_\__, | / / / /
 =========|_|==============|___/=/_/_/_/
 :: Spring Boot ::                (v2.5.4)


05-09-2021 11:57:16.090 [main] INFO  com.demo.ELK.ElkApplication.logStarting - Starting ElkApplication using Java 11.0.1 on Vulcan with PID 18048 (D:\Git Projects\ELK Logs Monitoring\ELK\target\classes started by ApoorvTyagi in D:\Git Projects\ELK Logs Monitoring\ELK)
05-09-2021 11:57:16.098 [main] INFO  com.demo.ELK.ElkApplication.logStartupProfileInfo - No active profile set, falling back to default profiles: default
05-09-2021 11:57:17.573 [main] INFO  o.s.b.w.e.tomcat.TomcatWebServer.initialize - Tomcat initialized with port(s): 8080 (http)
05-09-2021 11:57:17.589 [main] INFO  o.a.coyote.http11.Http11NioProtocol.log - Initializing ProtocolHandler ["http-nio-8080"]
05-09-2021 11:57:17.589 [main] INFO  o.a.catalina.core.StandardService.log - Starting service [Tomcat]
05-09-2021 11:57:17.589 [main] INFO  o.a.catalina.core.StandardEngine.log - Starting Servlet engine: [Apache Tomcat/9.0.50]
05-09-2021 11:57:17.679 [main] INFO  o.a.c.c.C.[Tomcat].[localhost].[/].log - Initializing Spring embedded WebApplicationContext
05-09-2021 11:57:17.679 [main] INFO  o.s.b.w.s.c.ServletWebServerApplicationContext.prepareWebApplicationContext - Root WebApplicationContext: initialization completed in 1533 ms
05-09-2021 11:57:18.143 [main] INFO  o.a.coyote.http11.Http11NioProtocol.log - Starting ProtocolHandler ["http-nio-8080"]
05-09-2021 11:57:18.321 [main] INFO  o.s.b.w.e.tomcat.TomcatWebServer.start - Tomcat started on port(s): 8080 (http) with context path ''
05-09-2021 11:57:18.329 [main] INFO  com.demo.ELK.ElkApplication.logStarted - Started ElkApplication in 3.131 seconds (JVM running for 3.654)
In case you are using an IDE like IntelliJ IDEA, you can run the Spring Boot application by following these instructions:
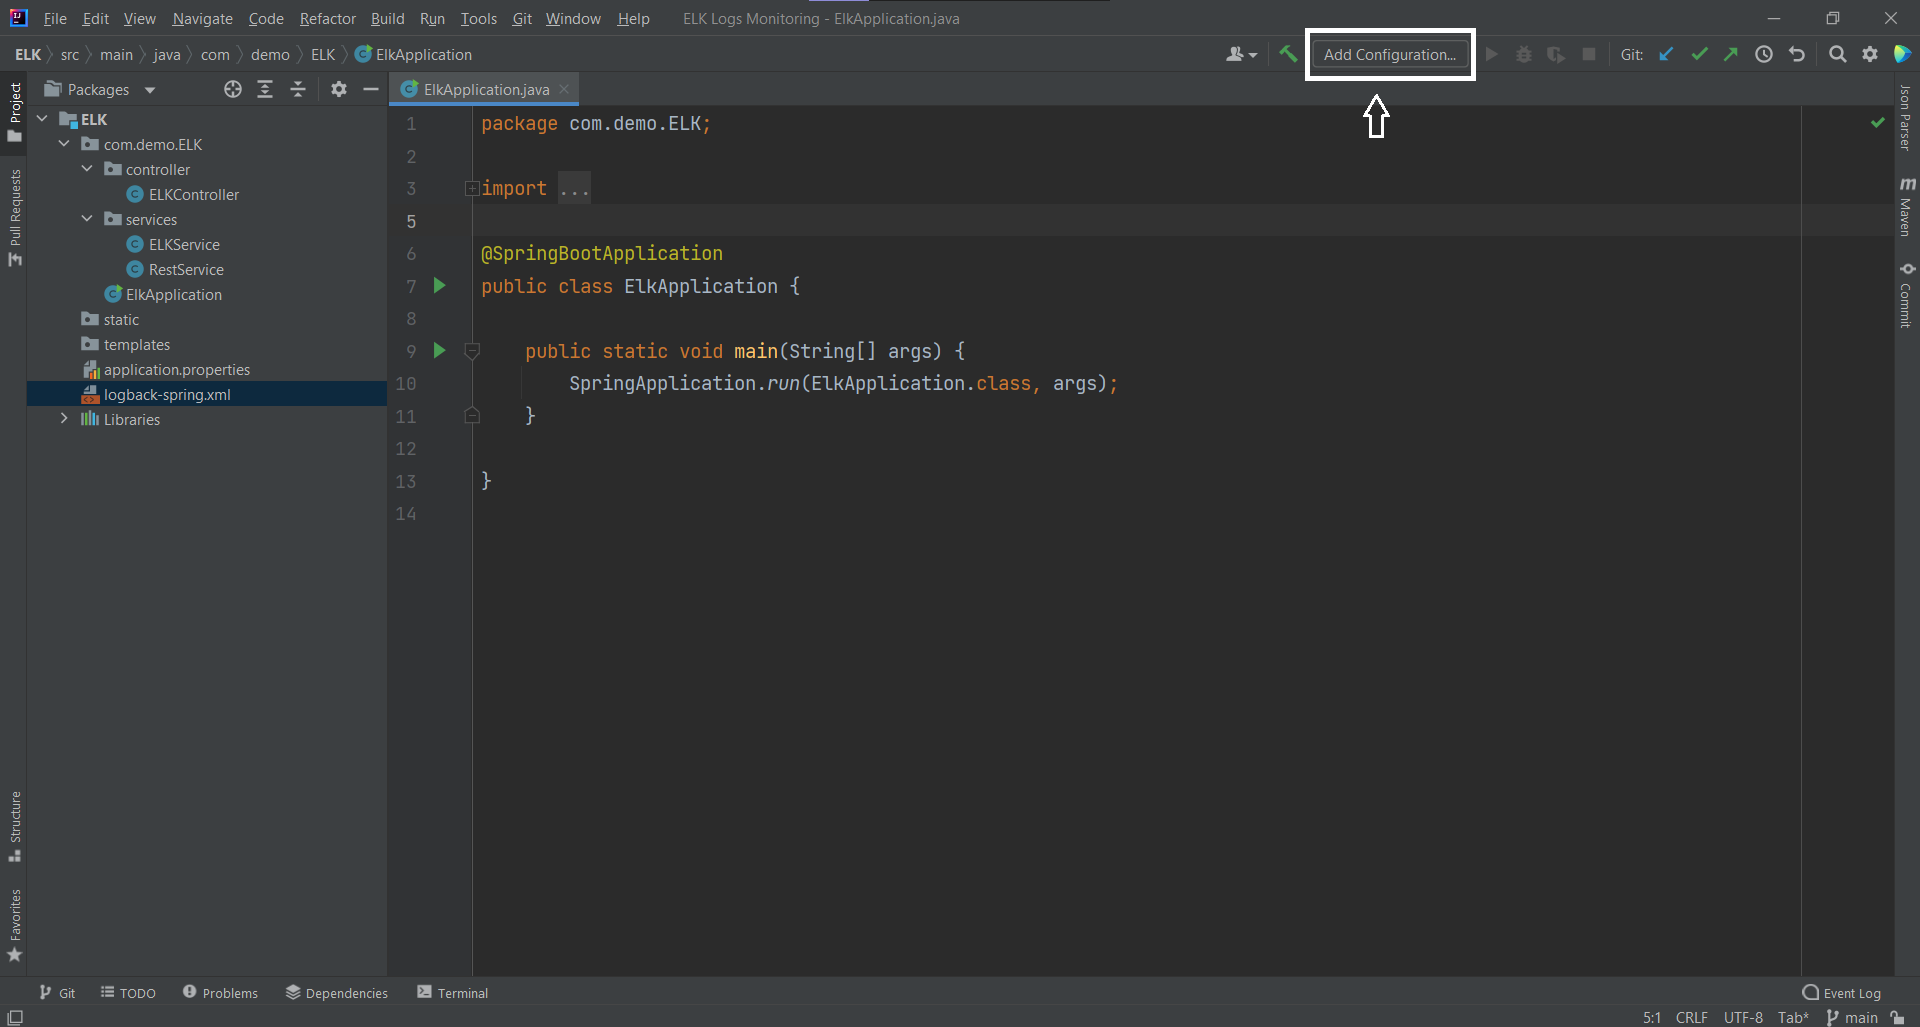
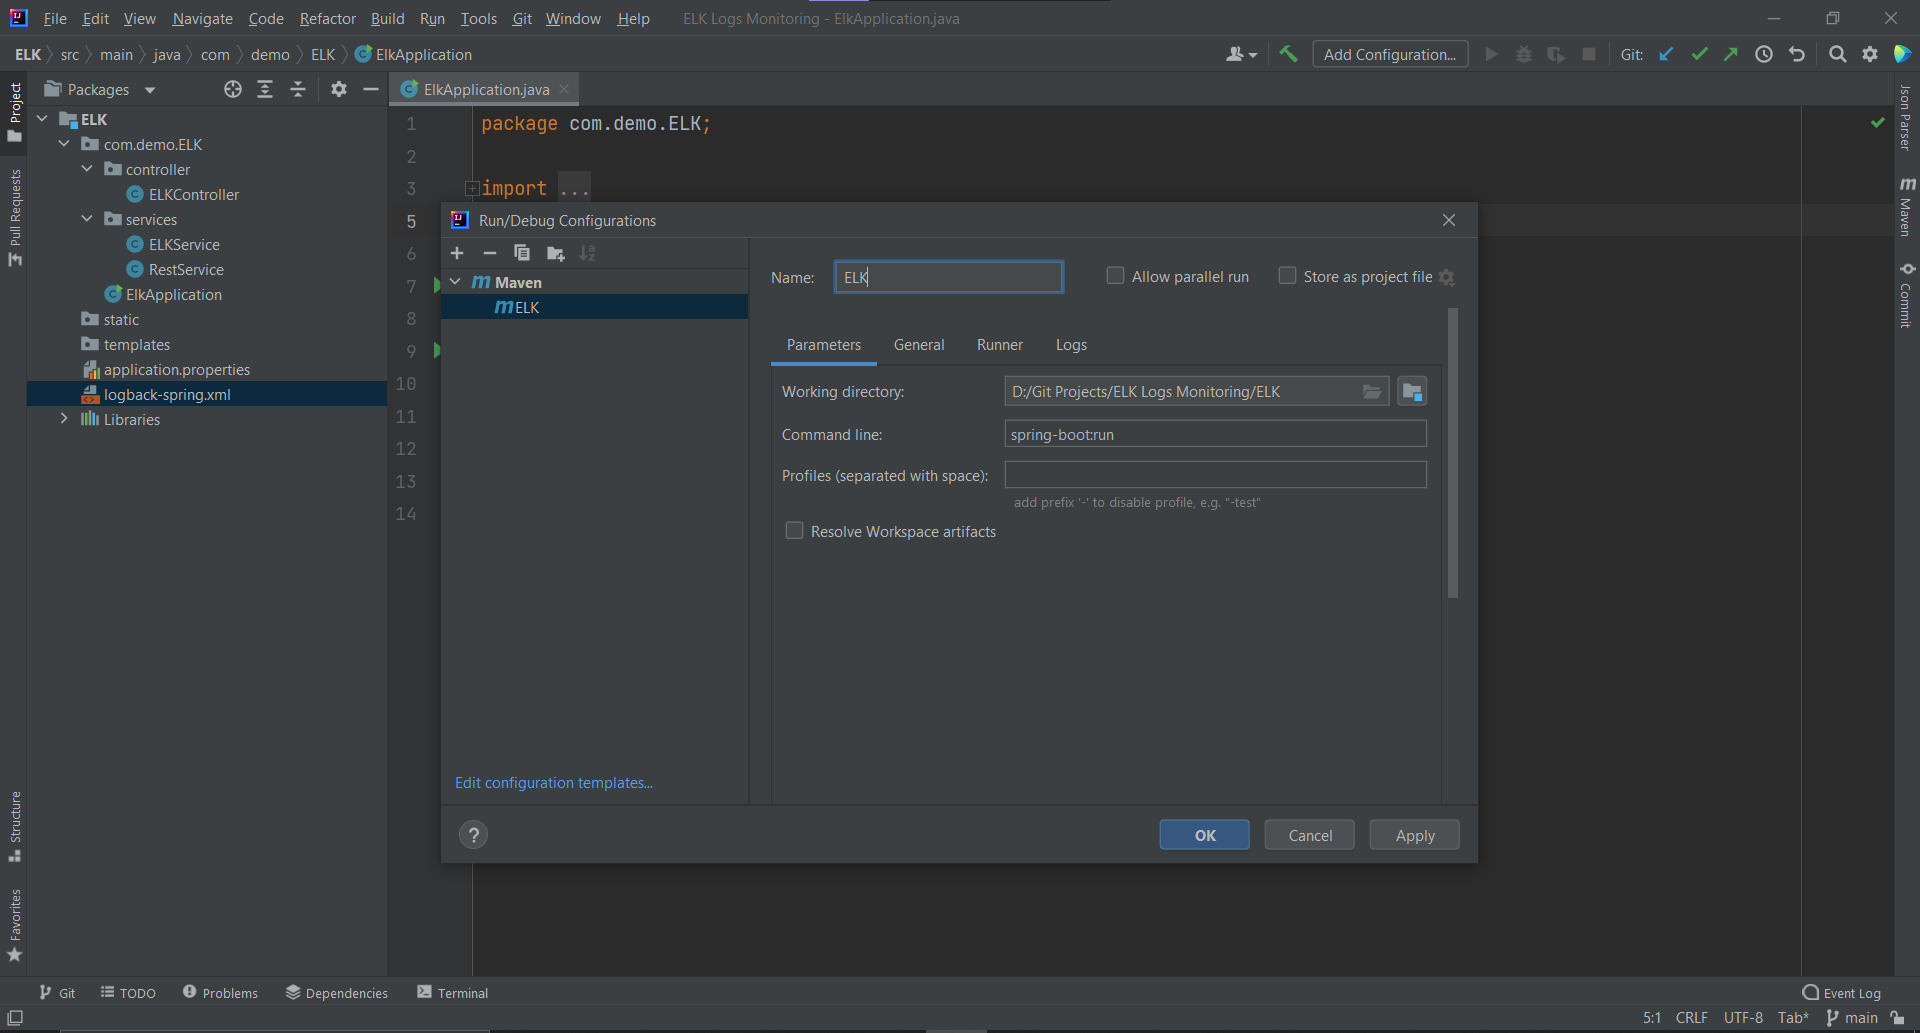
- Click on
Add Configurationfrom the top menu bar
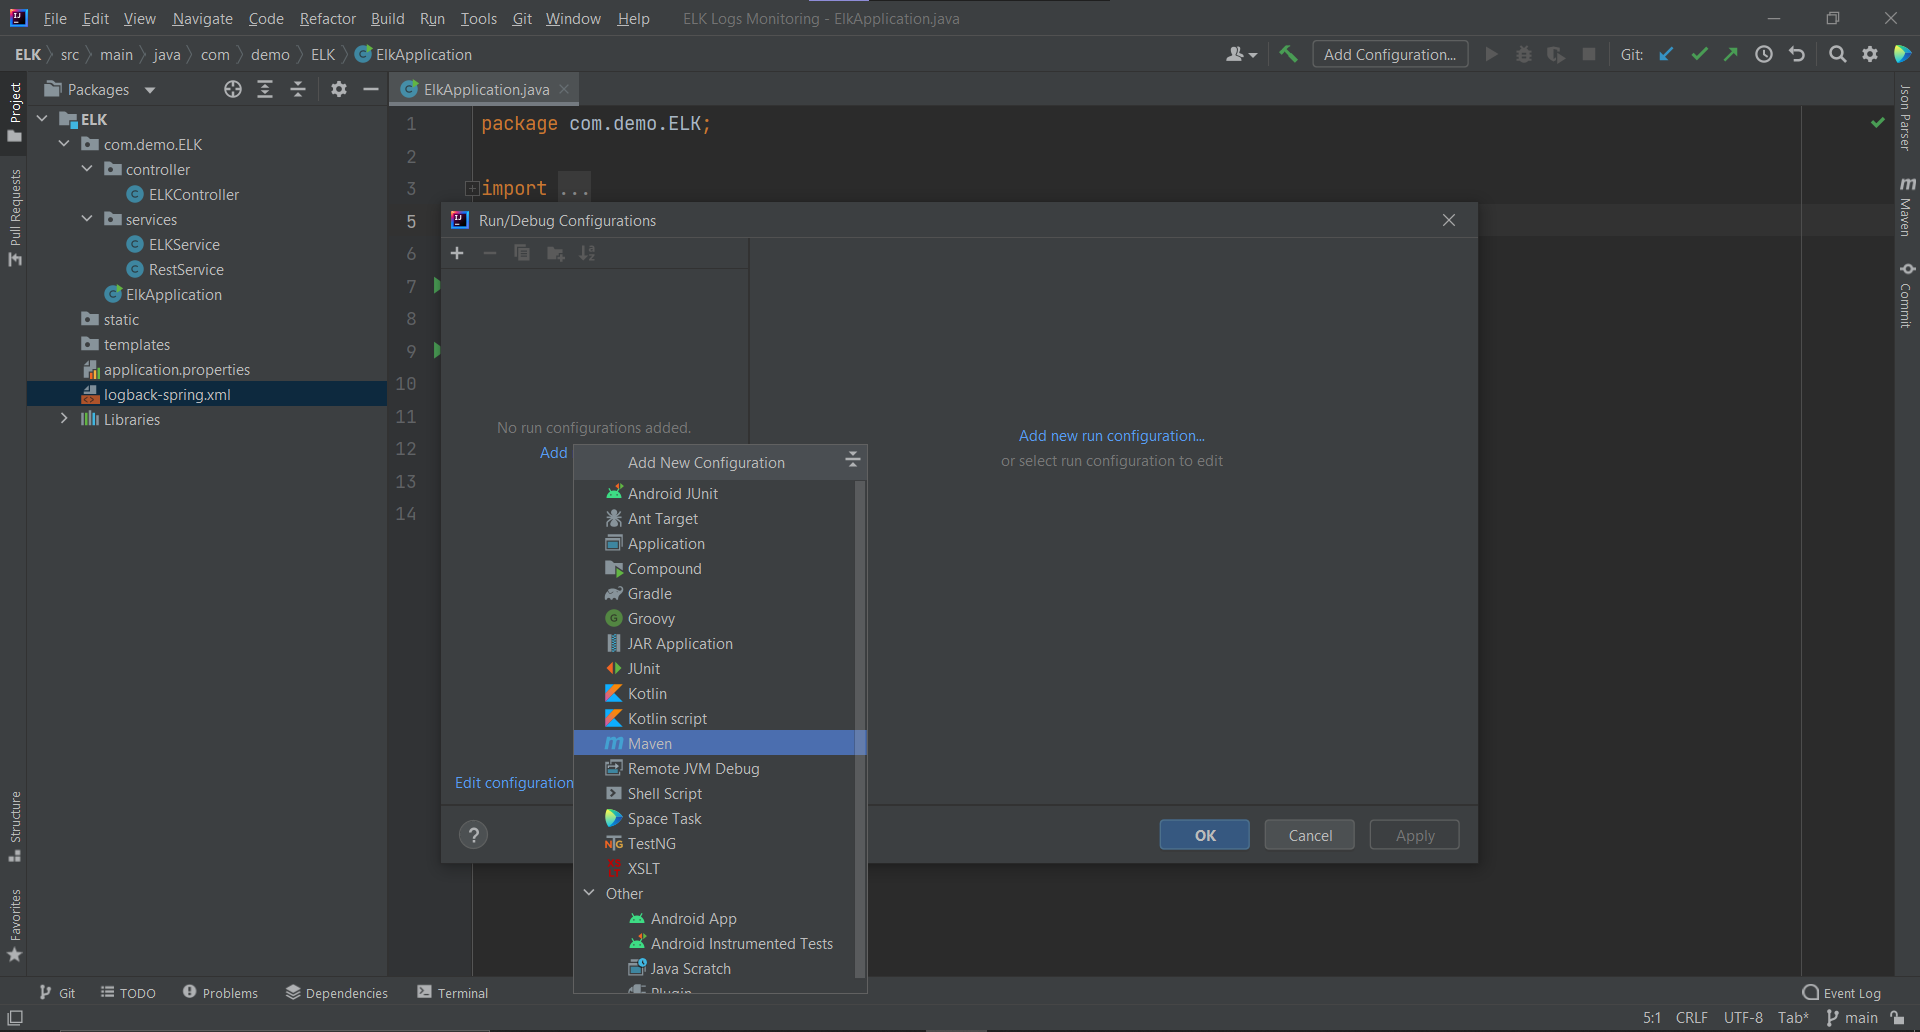
- A new dialog box will open, click on
Add new run configurationsand selectMavenfrom the dropdown
- Give your run configuration a name. The working directory will automatically get picked. You just have to put the command
spring-boot:runinside the command line and then click Apply and OK
Now run the application, and the next thing you have to do is to hit the endpoints via the Postman app to generate the response and logs:
- GET:
http://localhost:8080/api/get/hello
Hello World! Tue Aug 10 23:22:01 IST 2021- GET:
http://localhost:8080/api/get/Food-Details
[
{
"image": "🥑",
"quantity": "4 🥑",
"price": "6.50",
"description": "A ripe avocado yields to gentle pressure when held in the palm and squeezed. ",
"from": "Spain",
"id": 0,
"productName": "Fresh Avocados",
"organic": true,
"nutrients": "Vitamin B, Vitamin K"
},
{
"image": "🧀",
"quantity": "250g",
"price": "5.00",
"description": "Creamy and distinct in flavor, goat cheese is a dairy product enjoyed around the world.",
"from": "Portugal",
"id": 1,
"productName": "Cheese",
"organic": false,
"nutrients": "Vitamin A, Calcium"
},
{
"image": "🥦",
"quantity": "3 🥦",
"price": "5.50",
"description": "Broccoli is known to be a hearty and tasty vegetable which is rich in dozens of nutrients.",
"from": "Portugal",
"id": 2,
"productName": "Broccoli",
"organic": true,
"nutrients": "Vitamin C, Vitamin K"
}
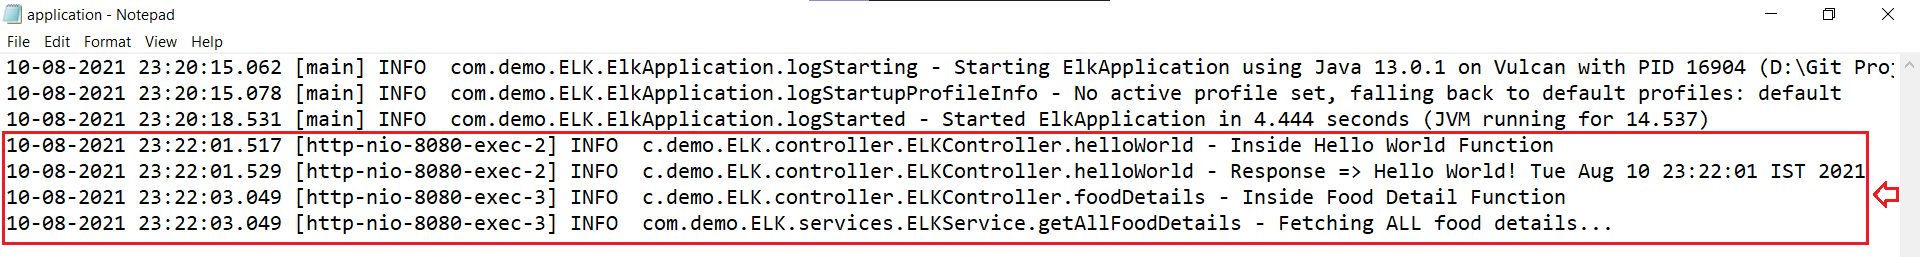
]If you check your IDE console, you can see the logs being printed inside it:
- Console Logs
10-08-2021 23:22:01.368 [http-nio-8080-exec-6] INFO  c.demo.ELK.controller.ELKController.helloWorld - Inside Hello World Function
10-08-2021 23:22:01.376 [http-nio-8080-exec-6] INFO  c.demo.ELK.controller.ELKController.helloWorld - Response => Hello World! Sun Aug 29 09:34:56 IST 2021
10-08-2021 23:22:03.955 [http-nio-8080-exec-7] INFO  c.demo.ELK.controller.ELKController.foodDetails - Inside Food Detail Function
10-08-2021 23:22:03.955 [http-nio-8080-exec-7] INFO  com.demo.ELK.services.ELKService.getAllFoodDetails - Fetching ALL food details...
Also, a new folder called logs is created inside the project root directory as specified in the logback-spring.xml. Navigate inside this folder, and you will have your application.log file containing all the logs generated after hitting those two API endpoints:
- File Logs
Integrating Logstash Pipeline
Let's go back to where you have your Logstash folder and open the logstash.conf file.
Add the following content to it:
input {
  file {
    type => "log"
    path => "/ELK/logs/application.log"    # Make sure you provide the absolute path of the file here
  }
}

filter {
  if [message] =~ "\tat" {
    grok {
      match => ["message", "^(\tat)"]
      add_tag => ["stacktrace"]
    }
  }

}

output {
  stdout {
    codec => rubydebug
  }

  elasticsearch {
    hosts => ["localhost:9200"]
  }
}
In the input, you have specified the type and the complete path of your file. Note that the value of the path must be absolute and cannot be relative.
In filters, wherever in the logs you will find a Tab character(\t) followed by "at", you will tag that entry as a stacktrace of an error. Grok is simply a filter plugin useful to parse and apply queries to unstructured data in Logstash.
In the output, you have defined a response that prints to the STDOUT of the console running Logstash using output codecs.
According to the official docs:
Output codecs are a convenient method for encoding your data before it leaves the output without needing a separate filter in your Logstash pipeline. Here,
rubydebugoutputs event data using the ruby "awesome_print" library. This is the default codec for stdout.
And finally, you have defined the output target where these logs have to be sent from logstash, that is, Elasticsearch running locally on port 9200.
Hit the API endpoints again to generate the logs:
http://localhost:8080/api/get/hellohttp://localhost:8080/api/get/Food-Details
This time you can see the logs printing in the logstash console as well. It means Logstash is successfully able to pick the Logs generated inside the application.log file:
{
    "@timestamp" => 2021-09-05T06:34:11.977Z,
       "message" => "29-08-2021 09:34:56.368 [http-nio-8080-exec-6] INFO  c.demo.ELK.controller.ELKController.helloWorld - Inside Hello World Function\r",
          "type" => "log",
      "@version" => "1",
          "host" => "Vulcan",
          "path" => "D:/Git Projects/ELK Logs Monitoring/ELK/logs/application.log"
}
{
    "@timestamp" => 2021-09-05T06:34:11.977Z,
       "message" => "29-08-2021 09:34:56.376 [http-nio-8080-exec-6] INFO  c.demo.ELK.controller.ELKController.helloWorld - Response => Hello World! Sun Aug 29 09:34:56 IST 2021\r",
          "type" => "log",
      "@version" => "1",
          "host" => "Vulcan",
          "path" => "D:/Git Projects/ELK Logs Monitoring/ELK/logs/application.log"
}
{
    "@timestamp" => 2021-09-05T06:34:11.977Z,
       "message" => "28-08-2021 20:33:24.598 [http-nio-8080-exec-1] INFO  c.demo.ELK.controller.ELKController.foodDetails - Inside Food Detail Function\r",
          "type" => "log",
      "@version" => "1",
          "host" => "Vulcan",
          "path" => "D:/Git Projects/ELK Logs Monitoring/ELK/logs/application.log"
}
{
    "@timestamp" => 2021-09-05T06:34:11.977Z,
       "message" => "28-08-2021 20:33:24.600 [http-nio-8080-exec-1] INFO  com.demo.ELK.services.ELKService.getAllFoodDetails - Fetching ALL food details...\r",
          "type" => "log",
      "@version" => "1",
          "host" => "Vulcan",
          "path" => "D:/Git Projects/ELK Logs Monitoring/ELK/logs/application.log"
}
Creating Indexes and Viewing Logs in Kibana
To access data from Elasticsearch, Kibana requires index patterns. As an analogy, in kibana, indexes are like the tables of a SQL database where you can store the data. Therefore, you must create an index pattern first to explore your data.
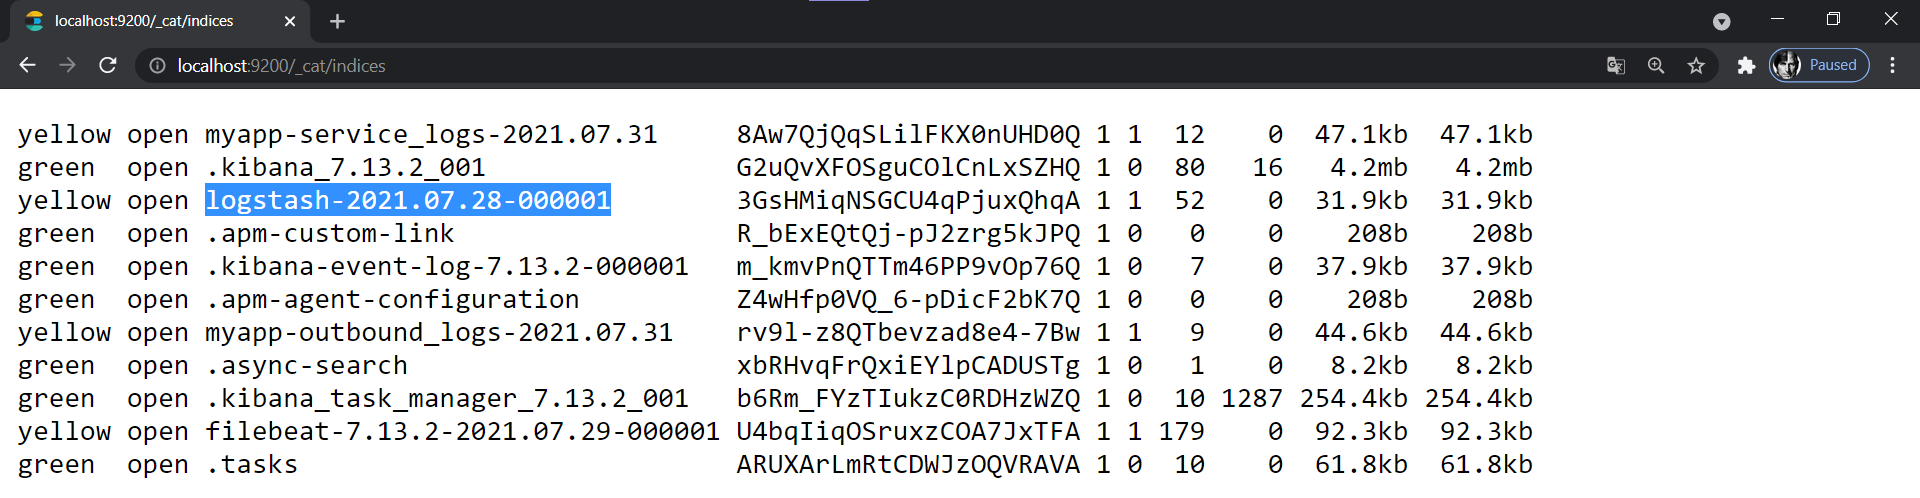
But how do you know what index to create?
For this, navigate to http://localhost:9200/_cat/indices; it will display all the indexes that have ever been created inside elasticsearch. Here you will see an index name starting with "logstash-". This is the index that has been created by Logstash.
Next, go to http://localhost:5601/app/management/kibana/indexPatterns and click on create index pattern on the top right.
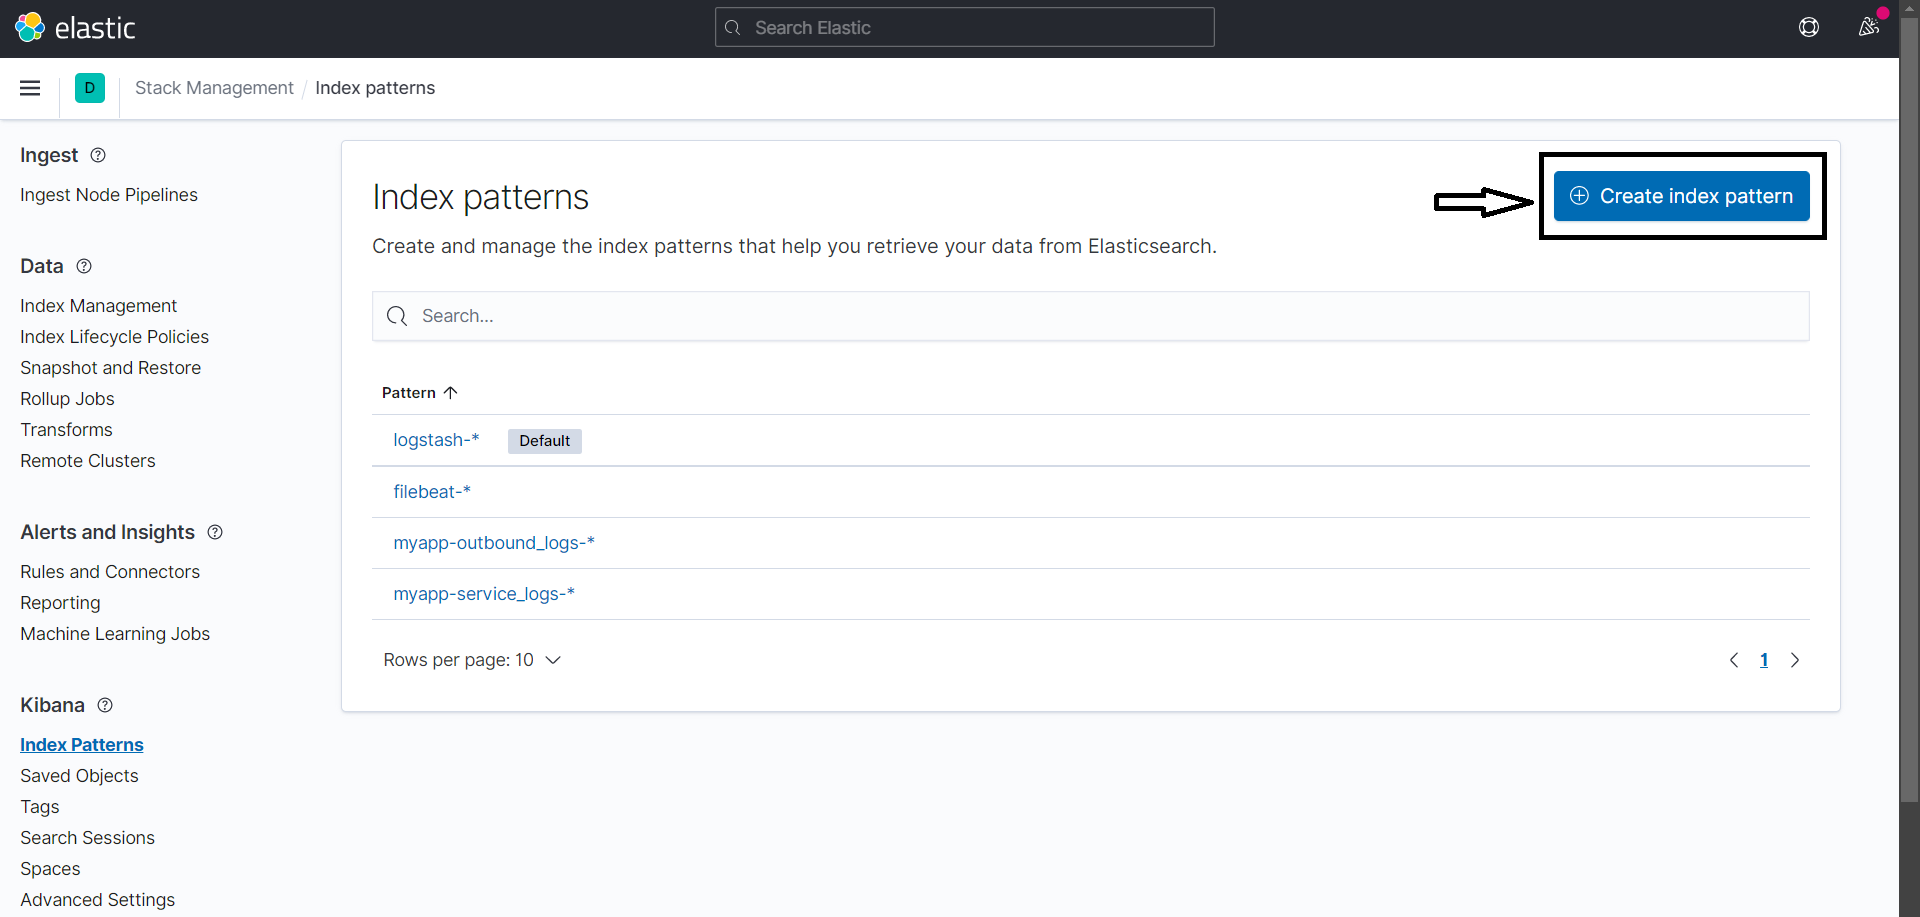
Type the index name as logstash-* and then click on next.
Optionally, in the next step, you can pick a field for filtering the data. You can choose @timestamp and then click on Create index pattern.
After this, head on to the http://localhost:5601/app/discover.
Select the index from the filters that you just created, and you'll be able to see and analyze the logs.
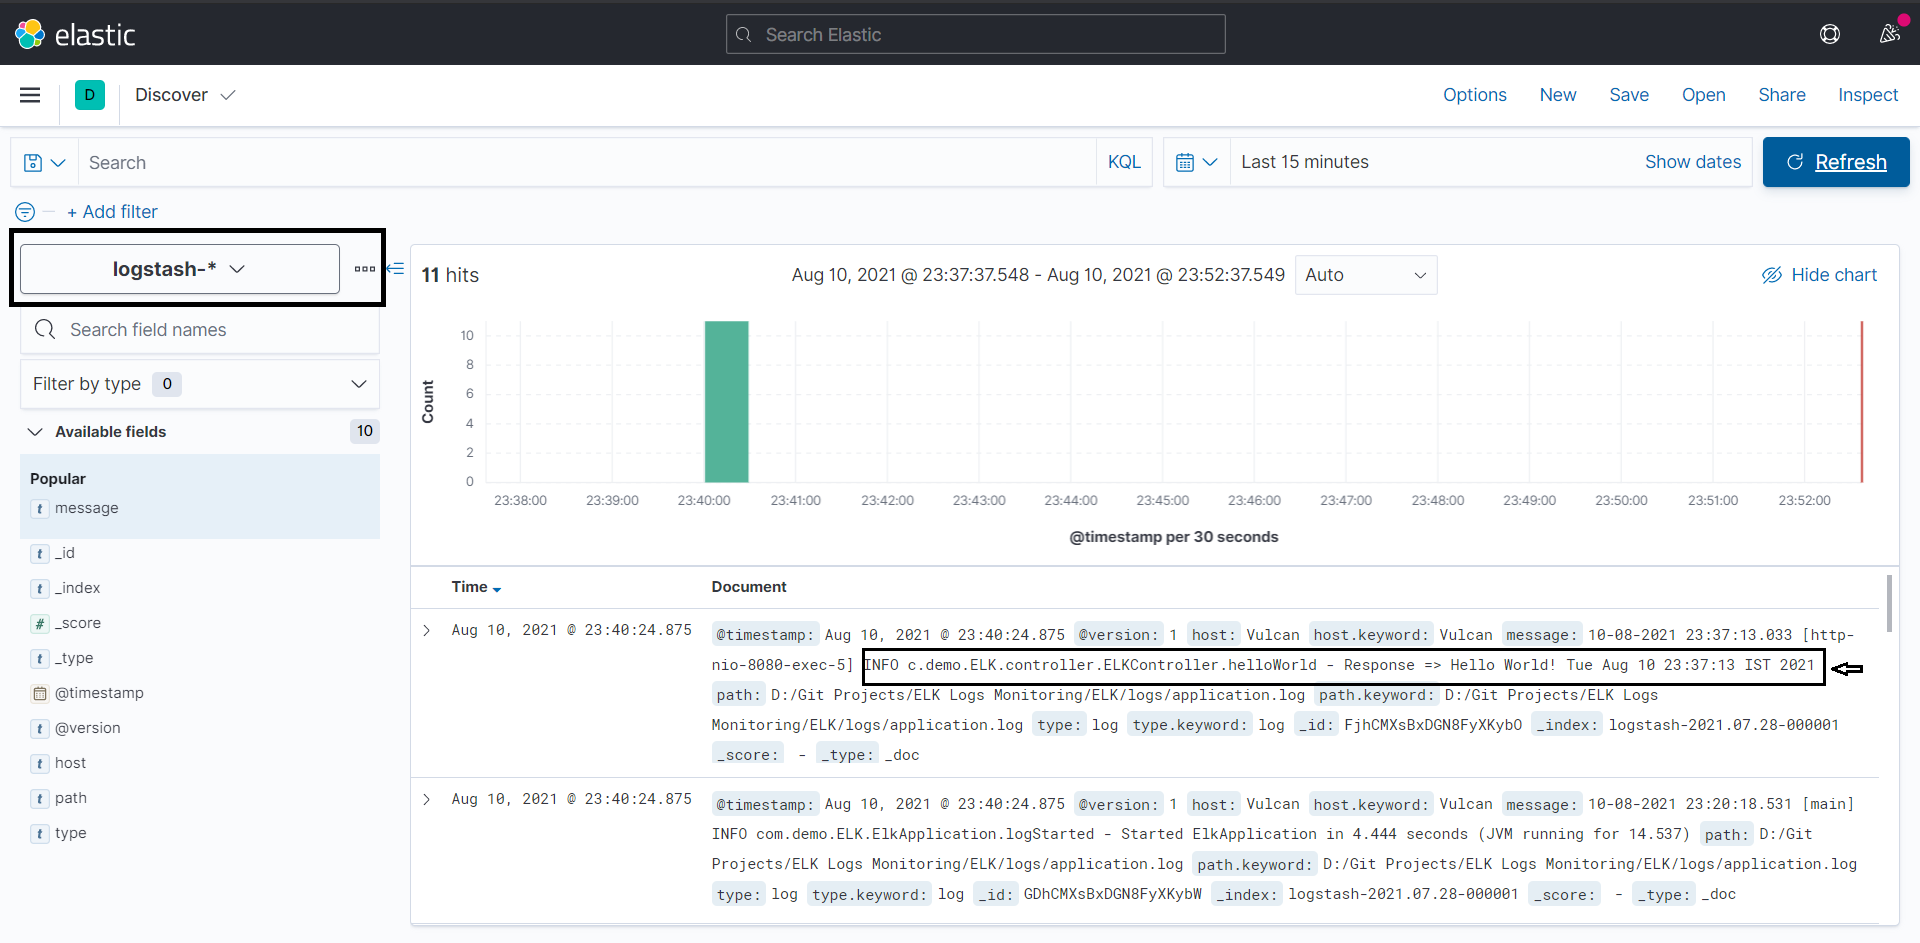
If you don't see data in Kibana, try changing the time filter to a larger range. By default, Kibana shows data for the last 15 minutes.
Clicking and expanding any one particular Log data and then selecting JSON will show the response in easier to read JSON format:
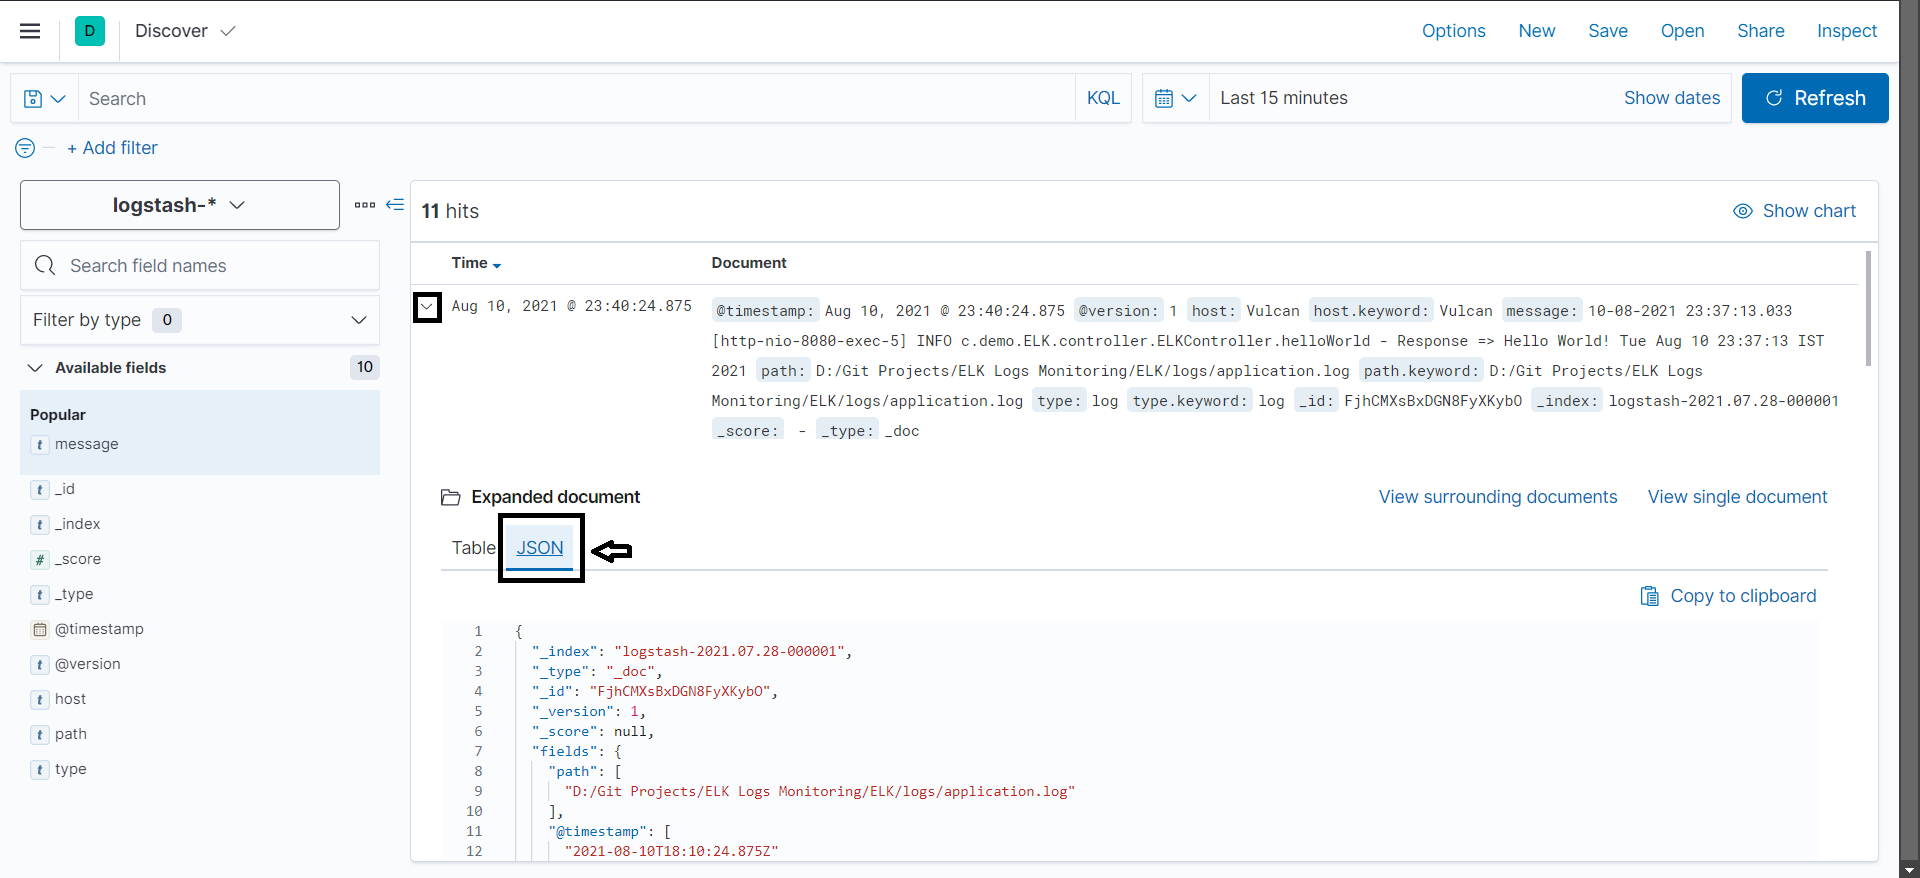
Here's how you can integrate the ELK stack with your Spring Boot app to collect, process, and visualize logs at a centralized place.
Introducing Beats
Until now, you have seen how to use the ELK stack for monitoring Spring Boot logs. Here, Logstash was reading log files.
Now, suppose you have to read data from log files from multiple file servers.
How should you approach this?
One simple option is adding Logstash on all the servers and passing the data to Elasticsearch.
But there is one problem, Logstash consumes a lot of resources. This can cause performance issues for high-traffic deployments servers. So it is not the best solution to use Logstash on all file servers.
As a solution to this, Beats were introduced.
Beats are open source data shippers that can be installed as agents on servers to send data directly to Elasticsearch or via Logstash, where it can be further processed and enhanced.
There are various Beats for different purposes:
- Filebeat: For file monitoring
- Metricbeat: For metrics monitoring
- Packetbeat: For network data monitoring
- Heartbeat: For uptime monitoring
You will be specifically looking at Filebeat for this tutorial.
When to Use Filebeat and When to Use Logstash?
Filebeat is considered one of the best log shippers as it is lightweight, supports SSL & TLS encryption, and is extremely reliable. However, it cannot transform the logs into easy-to-analyze structured data. That's the part performed by Logstash.
So, if you require advanced log enhancement like filtering out unwanted bits of data or transforming data to another format, you have to go for Logstash.
But if you are only interested in the timestamp and message content, you can choose Filebeat to act as your log aggregator, especially in a distributed environment.
Filebeat can either ship data directly to Elasticsearch or first to Logstash, and then Logstash can ingest this data to Elasticsearch. If you want to use the benefit of Filebeat and Logstash, you can very well go with the second approach.
Configuring Filebeat
You can configure Filebeat similar to how you have done for other ELK stacks.
Just extract the zip file after downloading it from the official Filebeat Downloads.
In Logstash, you have to modify the logstash.conf file; similarly, here, you have to do the same thing in filebeat.yml.
To run Filebeat, use the command
filebeat.exe -c filebeat.yml.
Let's now look at how you can incorporate it with your already existing Spring Boot project.
Integrating Filebeat with Spring Boot
Open filebeat.yml and add the following content:
filebeat.inputs:
  - type: log
    enabled: true
    paths:
        - /ELK/logs/application.log  # Make sure to provide the absolute path of the file

output.elasticsearch:
  hosts: ["localhost:9200"]
  protocol: "http"
In the input, you have to specify the complete path of the log file from where Filebeat will read the data.
In the output, you have to define the hosts as the Elasticsearch and the port on which it is configured to listen. The protocol takes either HTTP or HTTPS as one of its values. It specifies where Elasticsearch is reachable. In this case, it is HTTP.
Now run the file with the command filebeat.exe -c filebeat.yml.
Similar to what you have done for logstash, you need to create a filebeat index inside Kibana by getting the index name from the Elasticsearch indices list.
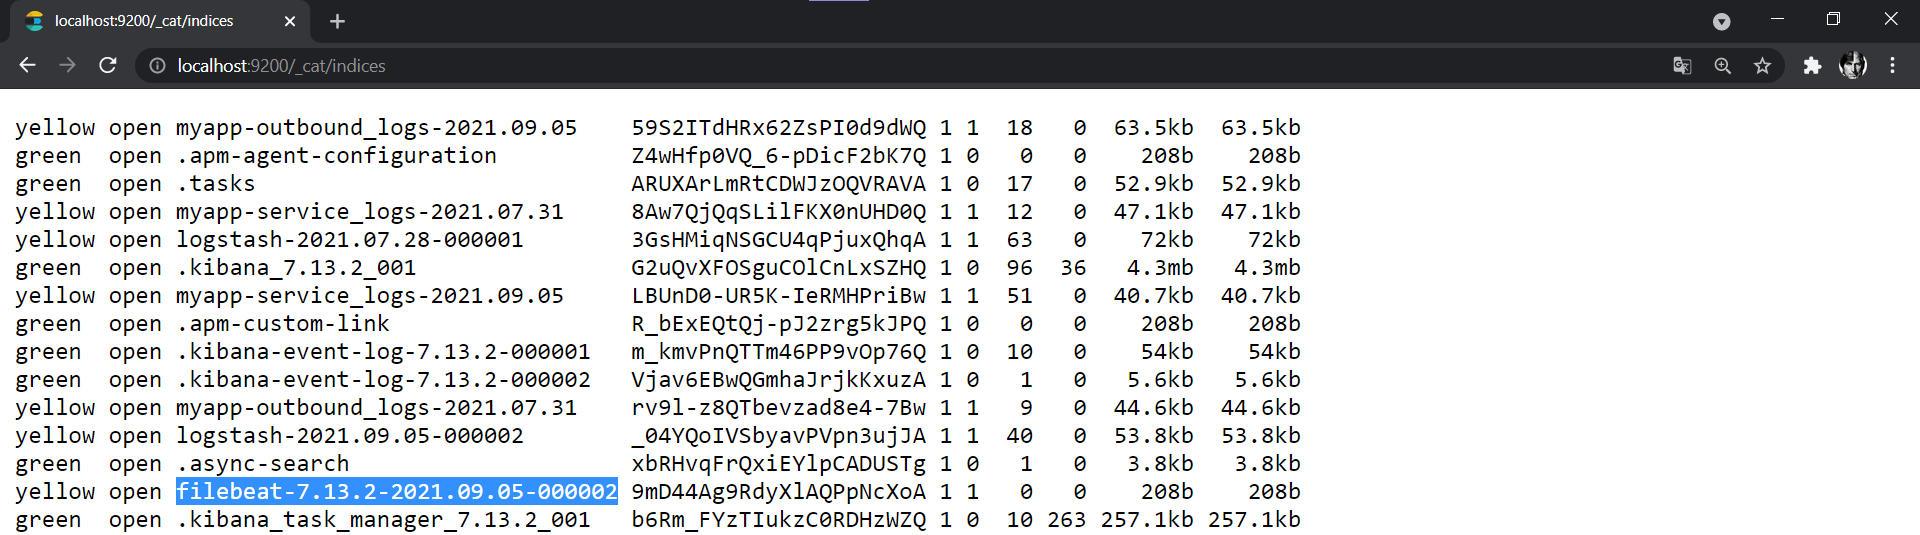
Here, you will see a new index name starting with "filebeat-". This is the index that has been created by Filebeat.
Next, navigate back to the index pattern management console in Kibana.
Click on the Create index pattern and type the index name as filebeat-*.
In the next step, pick a field for filtering the data. You can again pick @timestamp and then click on Create index pattern.
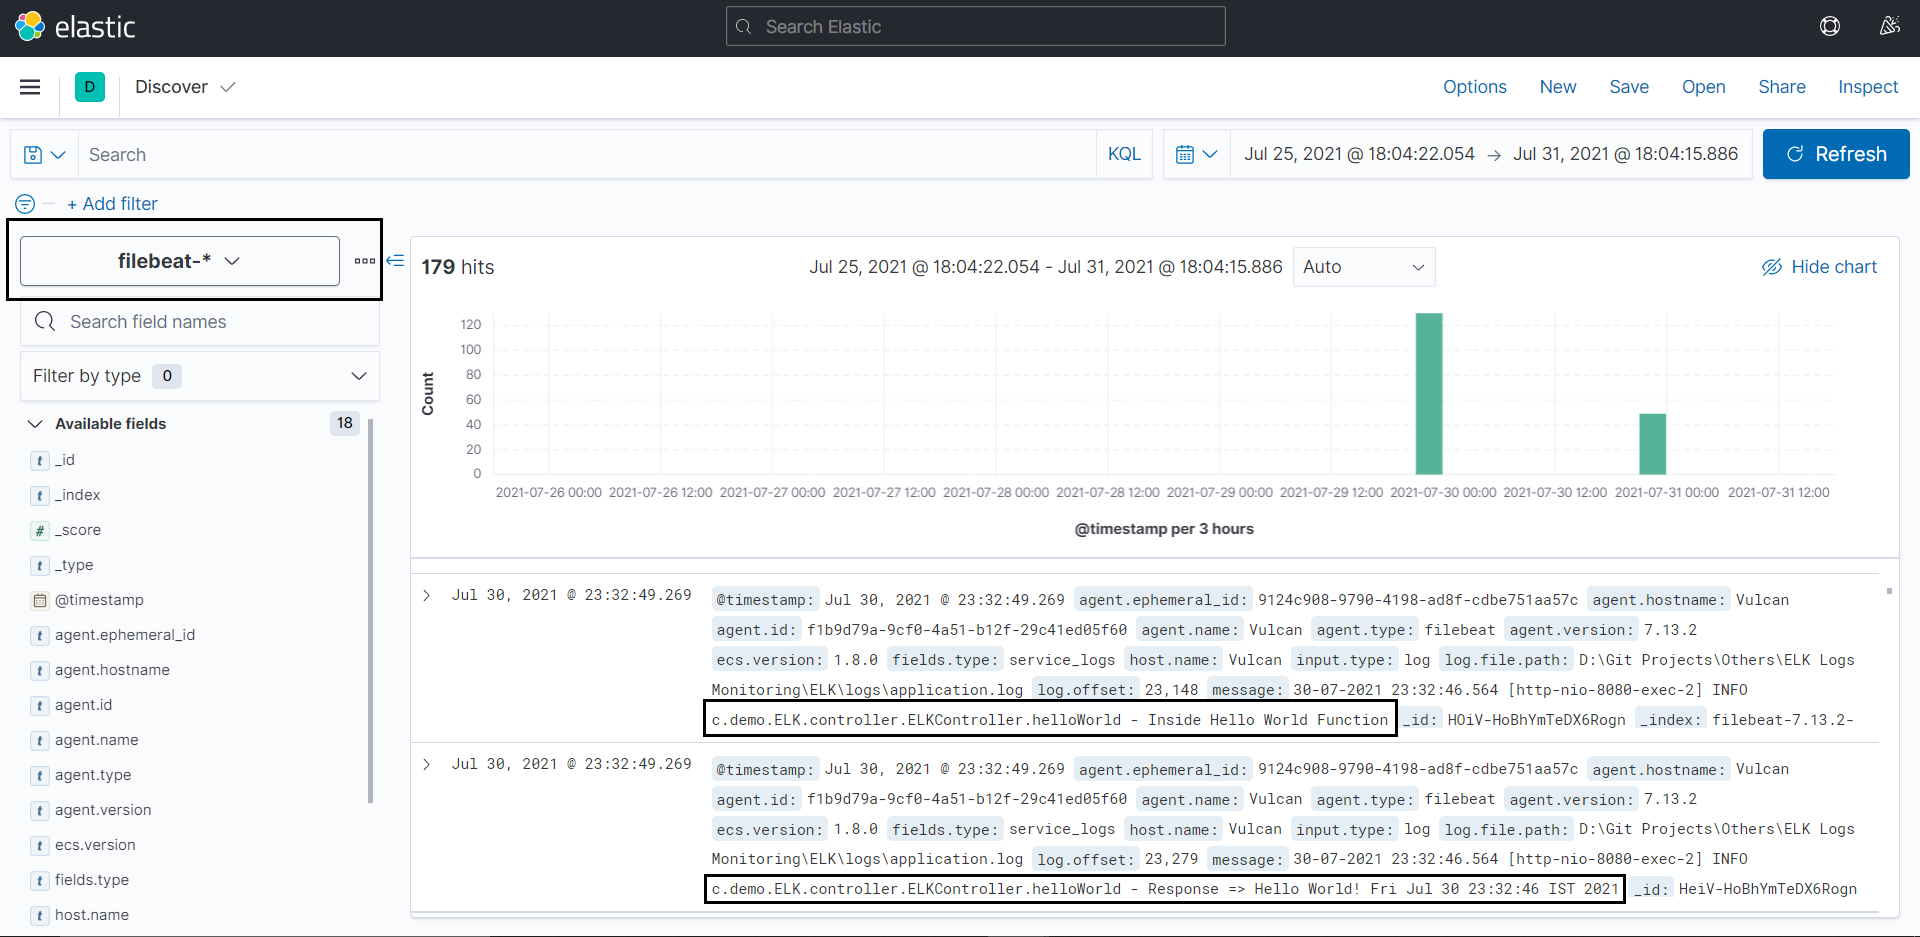
After this, head on to the http://localhost:5601/app/discover.
Select the filebeat index from the filters that you just created, and you'll be able to see and analyze the logs.
Combining Filebeat with Logstash
Let's say you are using Filebeat as your log shipper, and you want to transform the data which you are getting from the log file before passing it to Elasticsearch.
Since Filebeat doesn't allow any transformation to data, therefore, in this case, you have to use Logstash along with Filebeat.
Let us see how you can do that:
- Change the Filebeat output to Logstash and the port on which it is enabled, instead of Elasticsearch
filebeat.inputs:
  - type: log
    enabled: true
    paths:
        - /ELK/logs/application.log  # Absolute path of the log file

 output.logstash:
hosts: ["localhost:5044"] # Output is now pointing to Logstash- Modify the Logstash's input to read data from Filebeat instead of picking it from a file
input {
      beats {  # Notice the input is now being taken from 'Beats' instead of a 'file'
        type => "logs"
        port => "5044"
      }
}

filter {  # Adding the filters
  if [message] =~ "\tat" {
    grok {
      match => ["message", "^(\tat)"]
      add_tag => ["stacktrace"]
    }
  }

 mutate {
    replace => { "[host]" => "%{[host][name]}" }
  }
}

output {  # Output pointing to Elasticsearch
  stdout {
    codec => rubydebug
  }

  elasticsearch {
    hosts => ["localhost:9200"]
  }
}
Also, note that you have to add a new plugin(mutate) inside the filters.
This is because when you're using Filebeat and Logstash together, Filebeat automatically adds a host field with the type as an object to the logs events. At the same time, Logstash adds another host field of its own to the log events. But this host is of the string type instead of an object.
Because of these two different types of hosts, Elaticsearch will start throwing an error. To solve this, you need to decide whether you want to have the host as an object or a string.
In this case, we will go with the more straightforward way to replace the type of the host coming from Filebeat with a string type.
To do this, you have to use the Mutate filter plugin that allows you to perform general mutations on any field. You can replace and modify fields in your log events, as shown in the configuration above.
Verifying the Configurations
The next thing you have to do is to verify if the provided configurations are correct or not. The process for that remains the same as you did earlier. The Only difference is that this time you need to run both the filebeat.yml & logstash.conf together.
The complete process for that is mentioned below:
- Start your
filebeat.ymlandlogstash.conffiles. Also, make sure the predefinedlogsatsh-*index pattern is selected inside Kibana. - Next, just hit any one of the API endpoints again, and you will see the new logs coming in the Logstash console:
{
    "@timestamp" => 2021-09-09T16:55:40.112Z,
    "message" => "09-09-2021 22:25:36.174 [http-nio-8080-exec-3] INFO  c.demo.ELK.controller.ELKController.helloWorld - Inside Hello World Function",
    "input" => {
        "type" => "log"
    },
    "type" => "logs",
    "tags" => [
       [0] "beats_input_codec_plain_applied"
    ],
    "@version" => "1",
    "ecs" => {
        "version" => "1.8.0"
    },
    "host" => "Vulcan",
    "agent" => {
        "version" => "7.13.2",
        "name" => "Vulcan",
        "type" => "filebeat",
        "ephemeral_id" => "94a3a0f3-165f-4308-8333-c1afbef0e016",
        "hostname" => "Vulcan",
        "id" => "f1b9d79a-9cf0-4a51-b12f-29c41ed05f60"
    }
},
{
    "@timestamp" => 2021-09-09T16:55:40.112Z,
    "message" => "09-09-2021 22:25:36.177 [http-nio-8080-exec-3] INFO  c.demo.ELK.controller.ELKController.helloWorld - Response => Hello World! Thu Sep 09 22:25:36 IST 2021",
    "input" => {
        "type" => "log"
    },
    "type" => "logs",
    "tags" => [
        [0] "beats_input_codec_plain_applied"
    ],
    "@version" => "1",
    "ecs" => {
        "version" => "1.8.0"
    },
    "agent" => {
        "version" => "7.13.2",
        "name" => "Vulcan",
        "type" => "filebeat",
        "hostname" => "Vulcan",
        "ephemeral_id" => "94a3a0f3-165f-4308-8333-c1afbef0e016",
        "id" => "f1b9d79a-9cf0-4a51-b12f-29c41ed05f60"
    },
    "host" => "Vulcan"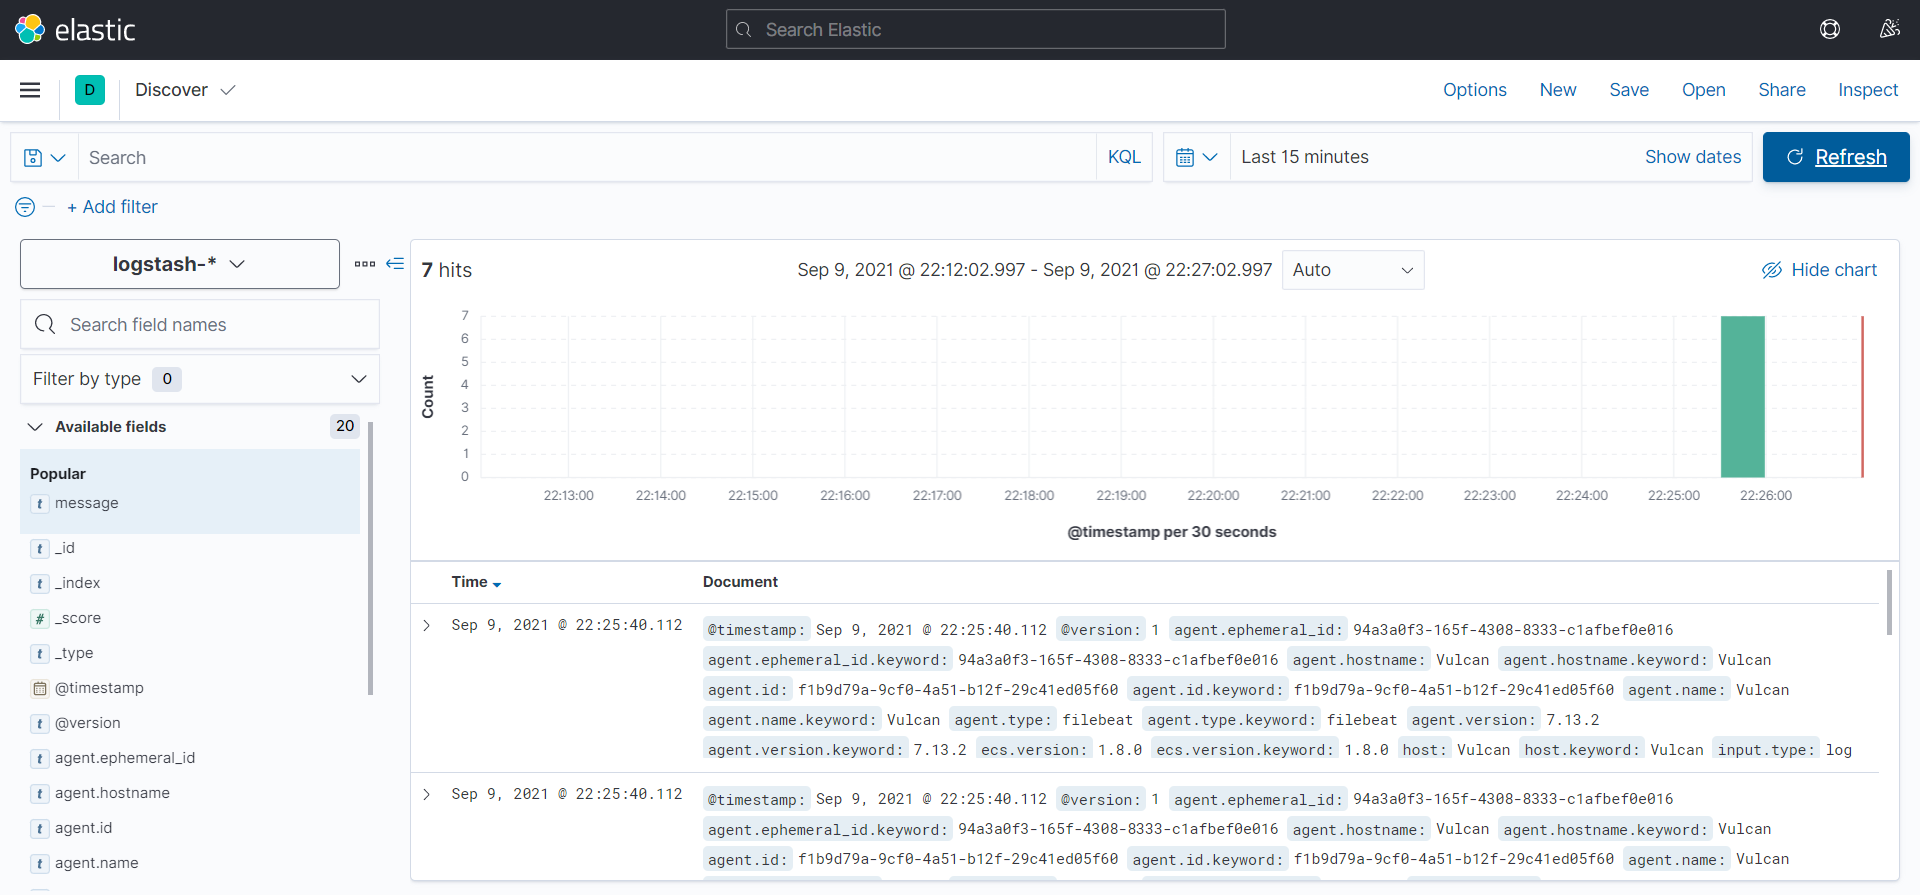
}- Finally, navigate to the Kibana console, and you will see the logs coming under the Logstash index:
Separating Logs in Kibana
In a large-scale distributed environment, there are high chances that you would have to run multiple interlinked applications. To visualize logs of all of them under a single index can sometimes become very cumbersome.
To solve this, you can simply separate the logs of each application by different indexes depending on your use cases.
For doing this, you have to differentiate between multiple log files using the property file.type inside the filebeat.yml.
Let's look at that with an example - Suppose in your application you have a service that asynchronously calls a third-party API to fetch some data.
It makes sense if you want to monitor the logs for this process in a separate index because it is independent of your application, and any failure occurring in this service should not be accounted inside the rest of the application's failure.
To achieve this, you will have to process the logs of this new service in a separate log file. So let's first add another logger and appender inside the logback-spring.xml file.
<?xml version="1.0" encoding="UTF-8"?>
<configuration>
    <appender name="STDOUT" class="ch.qos.logback.core.ConsoleAppender">
        <encoder>
            <pattern>%d{dd-MM-yyyy HH:mm:ss.SSS} %magenta([%thread]) %highlight(%-5level) %logger{36}.%M - %msg%n</pattern>
        </encoder>
    </appender>
    <appender name="SAVE-TO-FILE" class="ch.qos.logback.core.FileAppender">
        <file>logs/application.log</file>
        <encoder class="ch.qos.logback.classic.encoder.PatternLayoutEncoder">
            <Pattern>%d{dd-MM-yyyy HH:mm:ss.SSS} [%thread] %-5level %logger{36}.%M - %msg%n</Pattern>
        </encoder>
    </appender>
    <appender name="OUTBOUND_LOGS" class="ch.qos.logback.core.FileAppender">
        <file>logs/application-outbound.log</file>
        <encoder class="ch.qos.logback.classic.encoder.PatternLayoutEncoder">
            <Pattern>%d{dd-MM-yyyy HH:mm:ss.SSS} [%thread] %-5level %logger{36}.%M - %msg%n</Pattern>
        </encoder>
    </appender>
    <logger name="com.demo.ELK" additivity="false" level="info">
        <appender-ref ref="SAVE-TO-FILE" />
        <appender-ref ref="STDOUT" />
    </logger>
    <logger name="outbound-logs" additivity="false" level="info">
        <appender-ref ref="OUTBOUND_LOGS" />
        <appender-ref ref="STDOUT" />
    </logger>
    <root level="INFO">
        <appender-ref ref="STDOUT" />
    </root>
</configuration>
Here you have added another appender and logger by the name outbound-logs and have specified a different file name to print your logs in.
To use this inside your application, you have to initialize the logger object like this:
Logger log = LoggerFactory.getLogger("outbound-logs")
Now let's apply it inside one of your services:
package com.demo.ELK.services;

import com.fasterxml.jackson.databind.JsonNode;
import com.fasterxml.jackson.databind.ObjectMapper;
import org.slf4j.Logger;
import org.slf4j.LoggerFactory;
import org.springframework.boot.web.client.RestTemplateBuilder;
import org.springframework.stereotype.Service;
import org.springframework.web.client.RestTemplate;

@Service
public class RestService {

    // Initializing logger with new appender
    private static final Logger log = LoggerFactory.getLogger("outbound-logs");

    private final RestTemplate restTemplate;
    private final String BASE_URL = "https://goweather.herokuapp.com/weather/";

    public RestService(RestTemplateBuilder restTemplateBuilder) {
        this.restTemplate = restTemplateBuilder.build();
    }

    public JsonNode getPostsPlainJSON(String city) {
        log.info("Getting Weather Information for {}",city);
        String url = BASE_URL + city;
        log.info("Final URL => {}",url);
        try {
            String response = this.restTemplate.getForObject(url, String.class);
            ObjectMapper mapper = new ObjectMapper();
            log.info("Response => {}",response);
            return mapper.readTree(response);
        } catch (Exception e) {
            log.info("Error occurred in Outbound Request... => {}",e.getMessage());
        }
        return null;
    }
}
Everything that you log in to this service will go to the application-outbound.log file.
Let's create another endpoint in your controller class to test it:
@GetMapping(value = "/weather/{city}")
public JsonNode getWeatherInformation(@PathVariable String city){
   return restService.getPostsPlainJSON(city);
}
Finally, let's invoke it using HTTP GET method, e.g.: http://localhost:8080/api/weather/ohio
{
    "temperature": "+33 °C",
    "wind": "14 km/h",
    "description": "Partly cloudy",
    "forecast": [
        {
            "day": "1",
            "temperature": "+38 °C",
            "wind": "17 km/h"
        },
        {
            "day": "2",
            "temperature": "37 °C",
            "wind": "14 km/h"
        },
        {
            "day": "3",
            "temperature": "+39 °C",
            "wind": "22 km/h"
        }
    ]
}
With this, you should see the new logs being printed inside the application-outbound.log file in your logs folder:
22-08-2021 22:03:38.328 [http-nio-8080-exec-6] INFO  outbound-logs.getPostsPlainJSON - Getting Weather Information for ohio
22-08-2021 22:03:38.330 [http-nio-8080-exec-6] INFO  outbound-logs.getPostsPlainJSON - Final URL => https://goweather.herokuapp.com/weather/ohio
22-08-2021 22:03:39.912 [http-nio-8080-exec-6] INFO  outbound-logs.getPostsPlainJSON - Response => {"temperature":"+33 °C","wind":"14 km/h","description":"Partly cloudy","forecast":[{"day":"1","temperature":"+38 °C","wind":"17 km/h"},{"day":"2","temperature":"37 °C","wind":"14 km/h"},{"day":"3","temperature":"+39 °C","wind":"22 km/h"}]}
Modifying Filebeat and Creating Custom Index Pattern
Next, you also have to change your filebeat.yml to fetch the data from two different locations.
This is an important section where you will also learn how to create custom indexes instead of using the default ones that Filebeat generates.
An IMPORTANT thing to note here is that you have to disable ILM(Index Lifecycle Management) for using the custom indexes. (This is not mentioned in any elastic documentation but is a very important step)
ILM is nothing but the policy to manage indices according to the performance requirements. If this is enabled (which is true by default), you'll not be able to give any custom name to the index.
You also have to set the value for setup.template.name and setup.template.pattern to modify the index name.
By default, Filebeat creates index in pattern: “filebeat-%{[version]}-%{+yyyy.MM.dd}”.
To change this format, inside setup.template.name you have to set your custom index name like "myapp" and inside setup.template.pattern you have to put the same custom index name that you provided, followed by a hyphen(-) and asterisk (*), e.g., myapp-*
filebeat.inputs:
  - type: log
    enabled: true
    fields:
        type: "service_logs"
    paths:
        - /ELK/logs/application.log  # Absolute path of application.log file
  - type: log
    enabled: true
    fields:
        type: "outbound_logs"
    paths:
        - /ELK/logs/application-outbound.log  # Absolute path of application-outbound.log file

setup.ilm.enabled: false
setup.template.name: "myapp-%{[fields.type]:other}"
setup.template.pattern: "myapp-%{[fields.type]:other}-*"

output.elasticsearch:
  hosts: ["localhost:9200"]
  protocol: "http"
  index: "myapp-%{[fields.type]:other}-%{+yyyy.MM.dd}"
In Filebeat configuration, you have to use fields.type to distinguish among the different inputs from where you're fetching the data in case of multiple inputs.
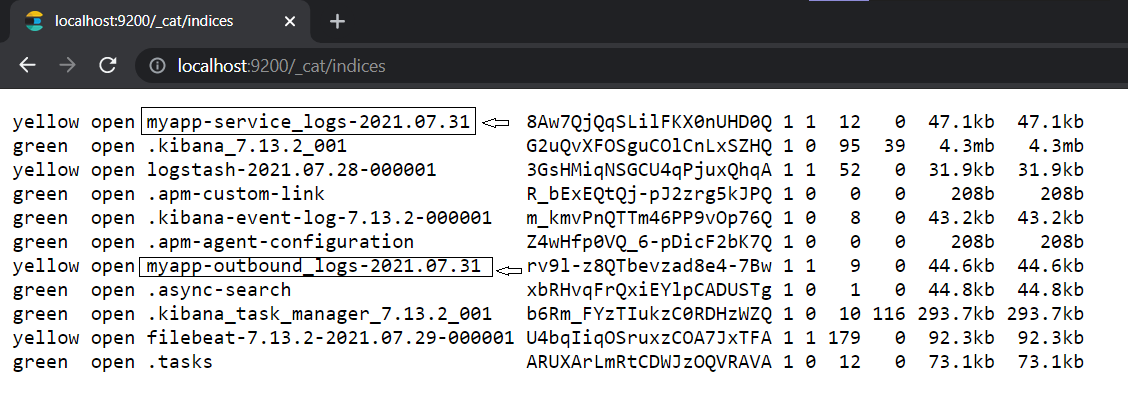
Now go to the Elasticsearch indices, and you'll see two new additional indexes starting with the name "myapp" followed by their respective values of fields.type:
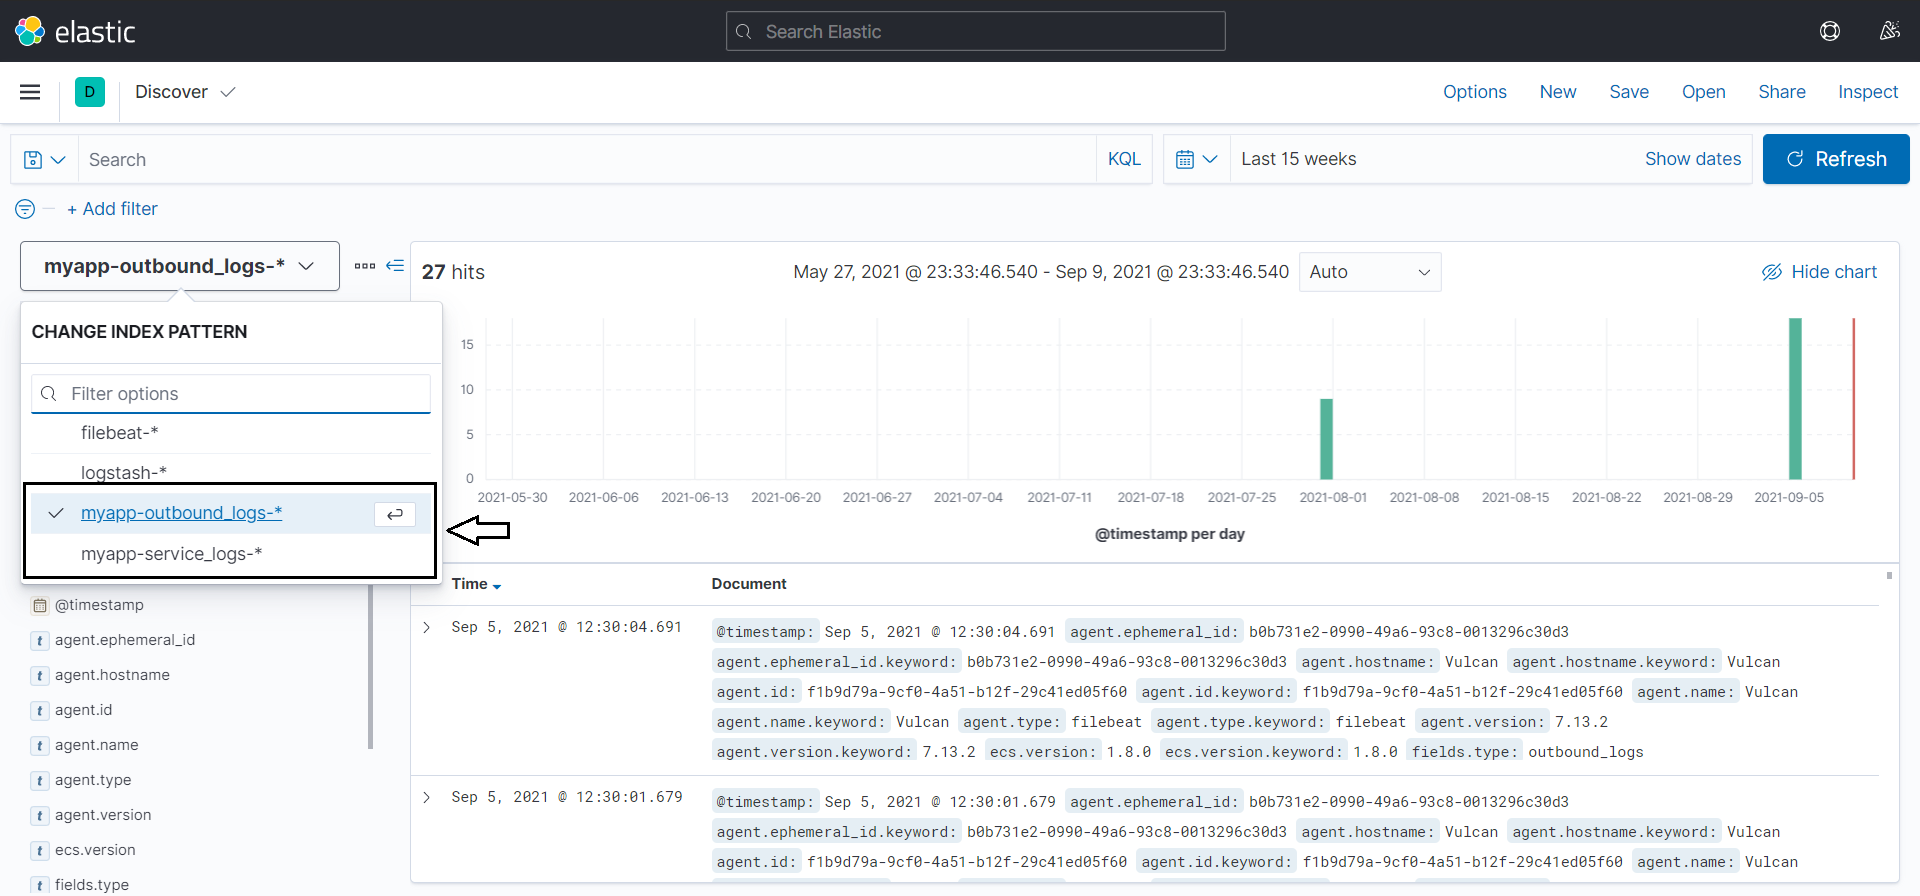
Create these two new patterns inside your Kibana index pattern management console by the name myapp-outbound_logs-* and myapp-service_logs-*.
Next, hit the REST APIs again, and you should be able to view the logs of your applications in separate indexes depending on the API you are hitting.
Summary
For any developer, logs are the most critical way for debugging. ELK Stack simplifies the delivery of logs in a centralized and scalable way. This article was an introduction to how it all works.
- You have gone through the step-by-step process of sending out Spring Boot application logs to the Elastic Stack(ELK).
- You got introduced to Filebeat and learned about the advantages and disadvantages of Filebeat and Logstash as log shippers.
- You learned how to create custom index patterns through a Filebeat configuration.
- You also got the hang of how you can manage logs of different services of the same applications by putting them in separate indexes.
The complete code used in this tutorial is available on this GitHub repository.


