Use Auth0 Dashboard Templates with Datadog
Auth0 provides predefined templates that you can use to visualize the data from your Auth0 tenant in Datadog. Display visualizations to monitor the health of the login traffic for a tenant. Templates allow you to use recommended aggregations from Auth0, or to use them as a starting point to create your own custom visualizations.
| Template | Purpose | Downloadable File |
|---|---|---|
| Security Dashboard | Monitor tenant login traffic including login, account creation, and anomaly detection metrics. | Auth0SecDashboard.json |
You can also organize your visualization using the following features:
Use Datadog time selection to choose the window for your visualization.
Use filters to narrow down data analysis using configurable parameters such as IP address, Country, User, and Client Application.
Use Edit Widgets to rearrange the tiles and visualizations, as well as create copies where you can inspect and add parameters to queries as needed.
Prerequisites
Download the desired dashboard template JSON file from Auth0.
Upload dashboard templates in Datadog
Log into Datadog.
Navigate to Dashboards on the left navigation bar.
Select Screenboard as the dashboard type.
On the blank canvas, in the upper right, select the gear icon and click Import Dashboard JSON.
Upload the JSON file for the dashboard you wish to use (for example,
Auth0SecDashboard.json).
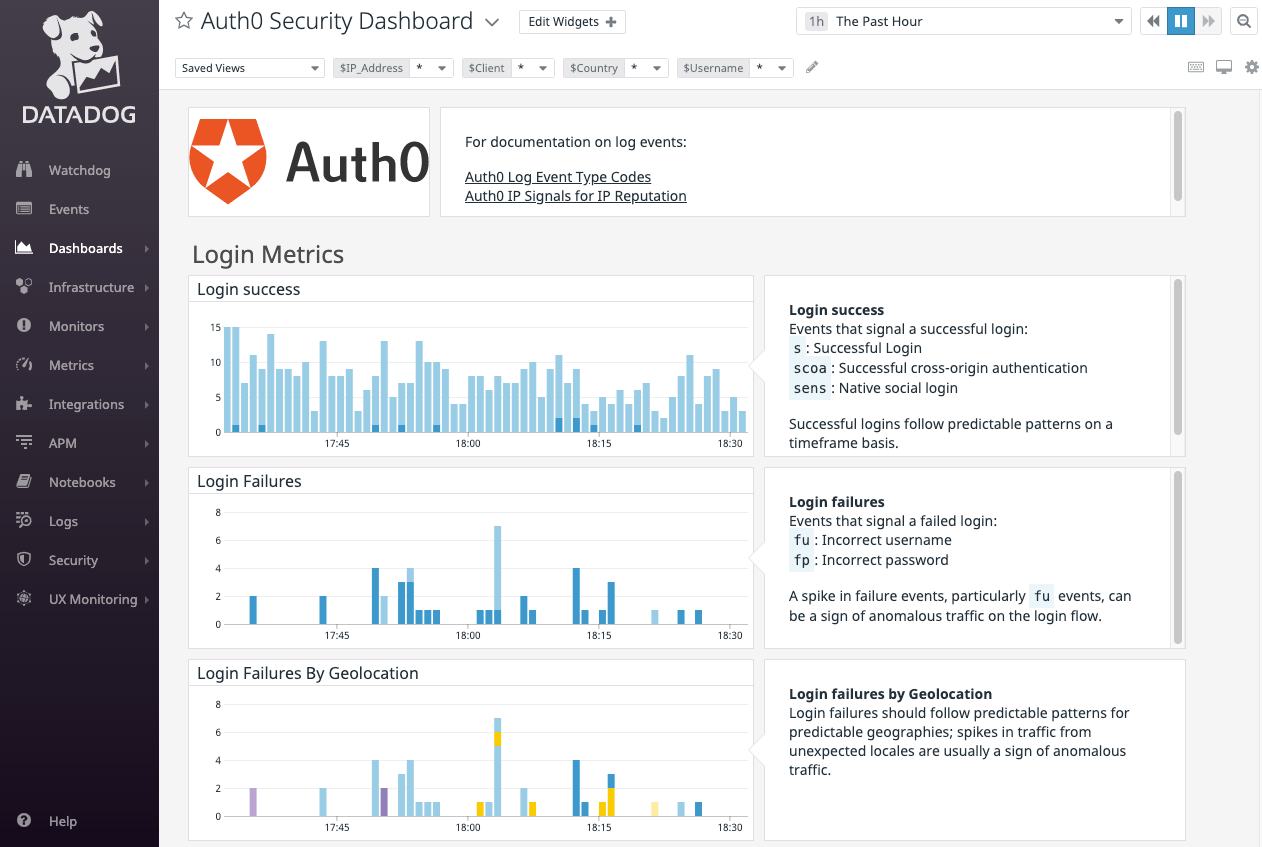
Security Dashboard visualizations
Once you have imported the Security Dashboard from Auth0, you can use the following visualizations to determine the health of your tenant or as a starting point to build your own visualizations and alerts in Datadog.
| Visualization | Purpose |
|---|---|
| Login Success | Displays the number of successful login events for the tenant. |
| Login Failures | Displays the number of failed login events for the tenant. Spikes in login failures may be a signal of anomalous traffic. |
| Login Failures by Geolocation | Displays the number of failed login events for the tenant by geolocation. Unexpected traffic spikes in certain geographies may be a signal of anomalous traffic. |
| Number of Unique IPs sending traffic | Displays the number of IP addresses that are sending traffic to the tenant. This number often follows predictable patterns, and strong variations may signal anomalous traffic. |
| Top 5 IPs with failures | Displays the 5 IP addresses that have experienced the highest number of login errors. |
| Account Creation Events in top countries | Displays the number of accounts created in the top countries. Variations in the predictable patterns and geographies may signal anomalous traffic. |
| Account Creation Events by Platform | Displays the number of accounts created by platform, such as Windows, OSX, Android, or iOS. |
| IPs with most accounts created | Displays the IP addresses from which the most number of accounts have been created. |
| Anomaly Detection Events | Displays the number of anomaly detection events for the tenant, including the number of blocked IP addresses due to Brute Force Protection and Breached Password Detection. |
| Log Stream | Displays raw events from the tenant log. |
Customize dashboard
You can customize your Datadog Auth0 security dashboard to add custom data widgets.
Navigate to your Auth0 security dashboard and go to the Dashboards item in the side navigation.
Select the name of the dashboard you created from the list.
Select a visualization and drag it to the main section of the page.
Configure your data graph preferences.
