From online retail to social media — and everything in between — bots are (one of the reasons) why we can’t have nice things. As we examine in detail in our State of Secure Identity Report, these digital automatons plague Identity flows at all parts of the user journey:
- Fake signups defraud registration forms and pollute customer intelligence systems;
- Brute force attacks use breached passwords in account takeover (ATO) attacks; and
- Malicious bots burden app owners with scams and spam, degrading the user experience.
Consumer-facing apps, in particular, must identify and filter out bots as part of their security and growth objectives — and since day one, Auth0 has devoted considerable effort to helping our customers do just that.
Bot or Not?
As a vital part of the Attack Protection add-on in the Okta Customer Identity Cloud, our Bot Detection feature mitigates scripted attacks against native applications, passwordless flows, and custom login pages.
By correlating a variety of data sources — like past events associated with an IP address, recent login history, IP reputation data, and an assortment of other factors — we can detect when an Identity request is likely to be coming from a bot. When the Bot Detection feature detects bot or scripted login requests, it triggers a CAPTCHA step in the login flow.
Over the years, we’ve continually refined our bot detection capabilities: today’s version employs a machine learning (ML) model that ingests 60+ inputs — and when we introduced this new system last year, it reduced bot attacks by 79% above and beyond its precursor.
Importantly, the improved defensive capabilities were achieved without the expense of user friction: even during attacks, fewer than 1% of challenges are shown to legitimate human users.
Building on Bot Detection: The Identity Threat Level (ITL)
Being at the ‘front door’ of applications with a Customer Identity and Access Management (CIAM) solution that secures billions of login transactions per month, Auth0 has a unique vantage point from which to monitor Identity threats.
This powerful perspective was the genesis of the Identity Threat Level (ITL), a score from 0 to 10 that indicates the level of bot activity targeting CIAM systems: a score of 0 means there’s practically no bot activity to speak of, while a score of 10 means almost all traffic is attributable to bots.
By aggregating (anonymously, of course!) observations across our customer base, we can calculate an ITL for different industries and geographies, with the option of introducing additional slicing and dicing on other common attributes.
Tracking historical trends and daily shifts has the potential to inform of elevated risks to CIAM login and sign-up flows, enabling app providers to increase their own monitoring, proactively tighten thresholds, implement additional defenses — or respond in any other way they see fit.
Sneak-Peak Observations
While future posts will explore the ITL in greater detail, including diving into Identity trends and perhaps even specific attack campaigns, in this post, we’ll stick to some high-level observations.
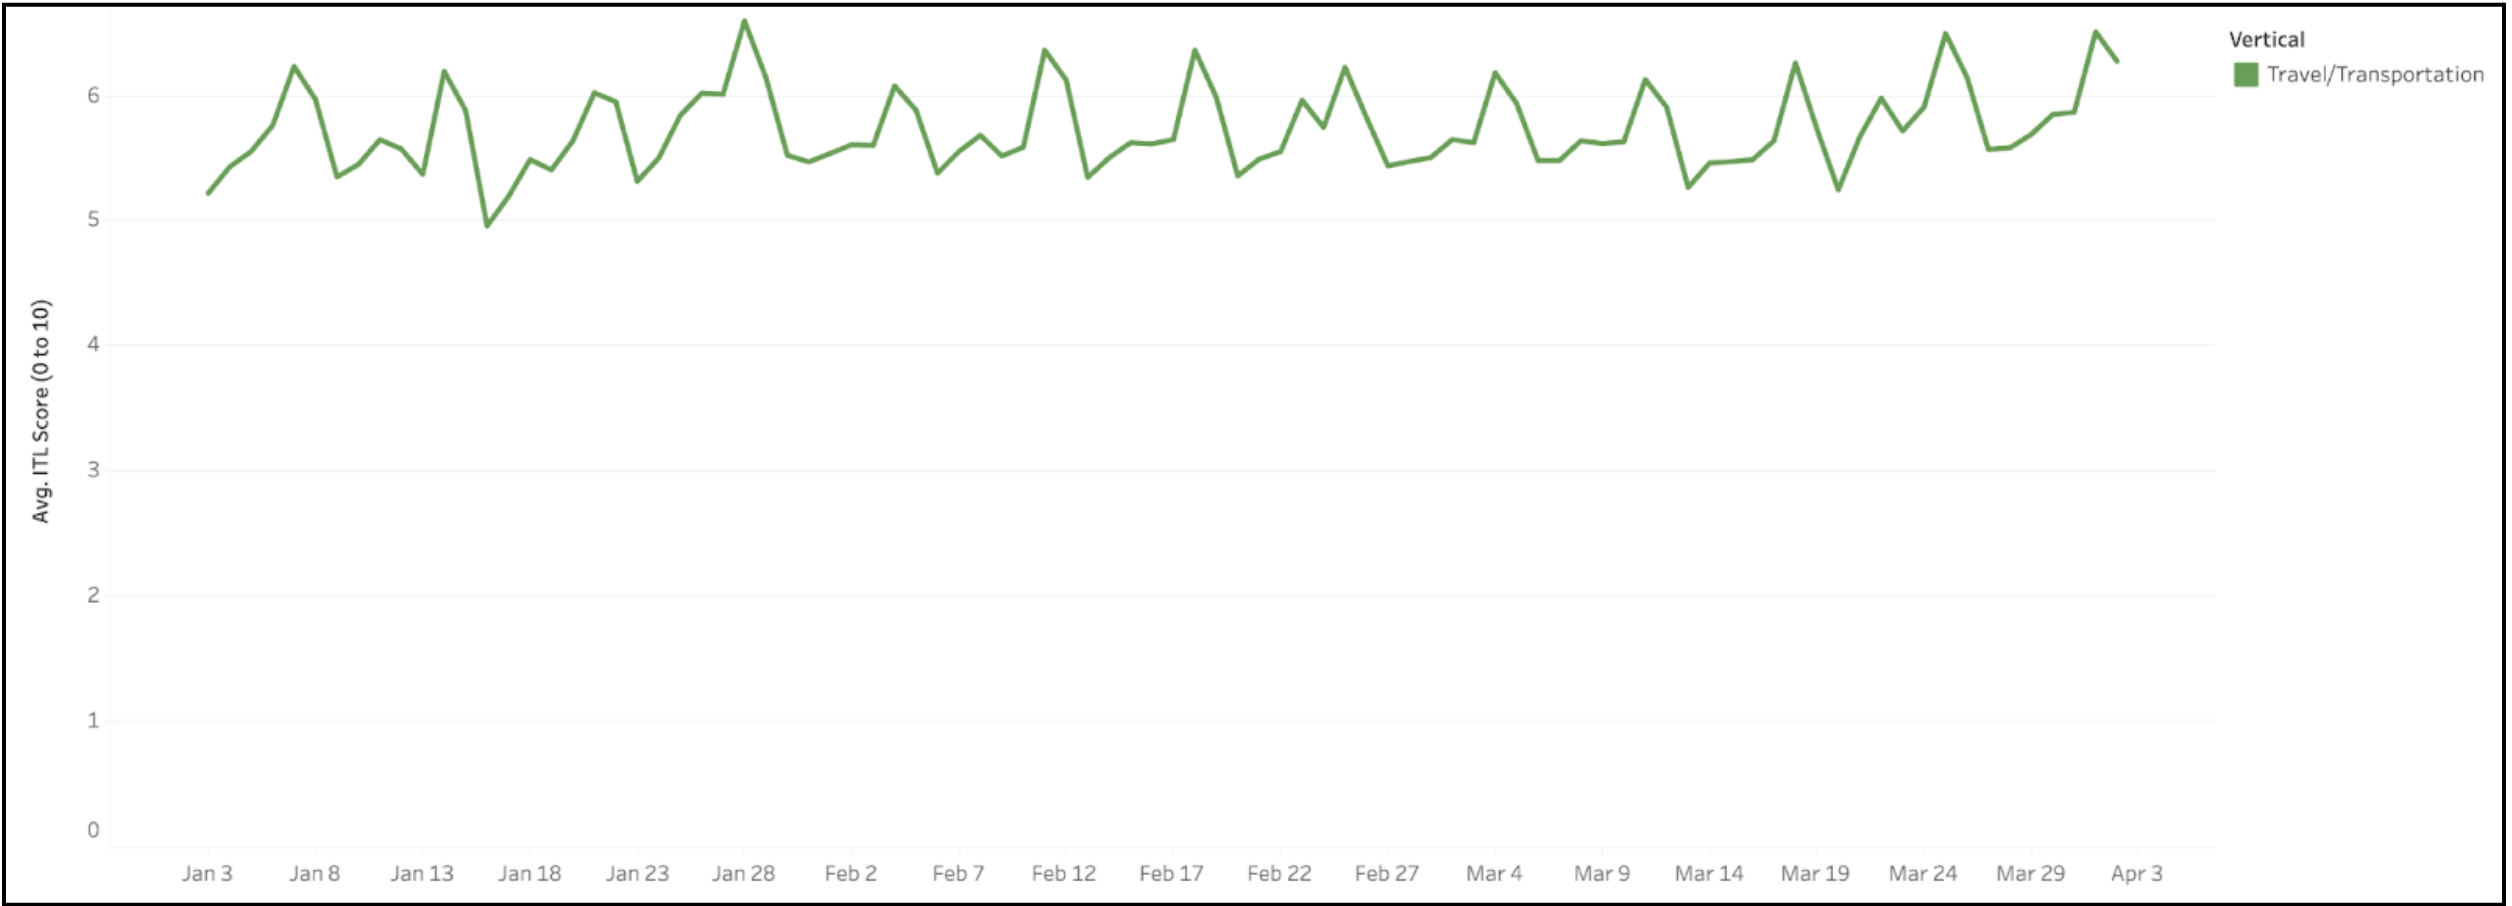
For example, consider the chart below, which shows the ITL for the Travel/Transportation industry, across all regions, from January 1st, 2023, through April 1st, 2023.
Just from a quick visual examination, we can see that so far in 2023, this ITL fluctuates up and down around an average of about 5.5, with the peaks corresponding to weekends (some industries exhibit this weekday/weekend pattern, and others don’t).
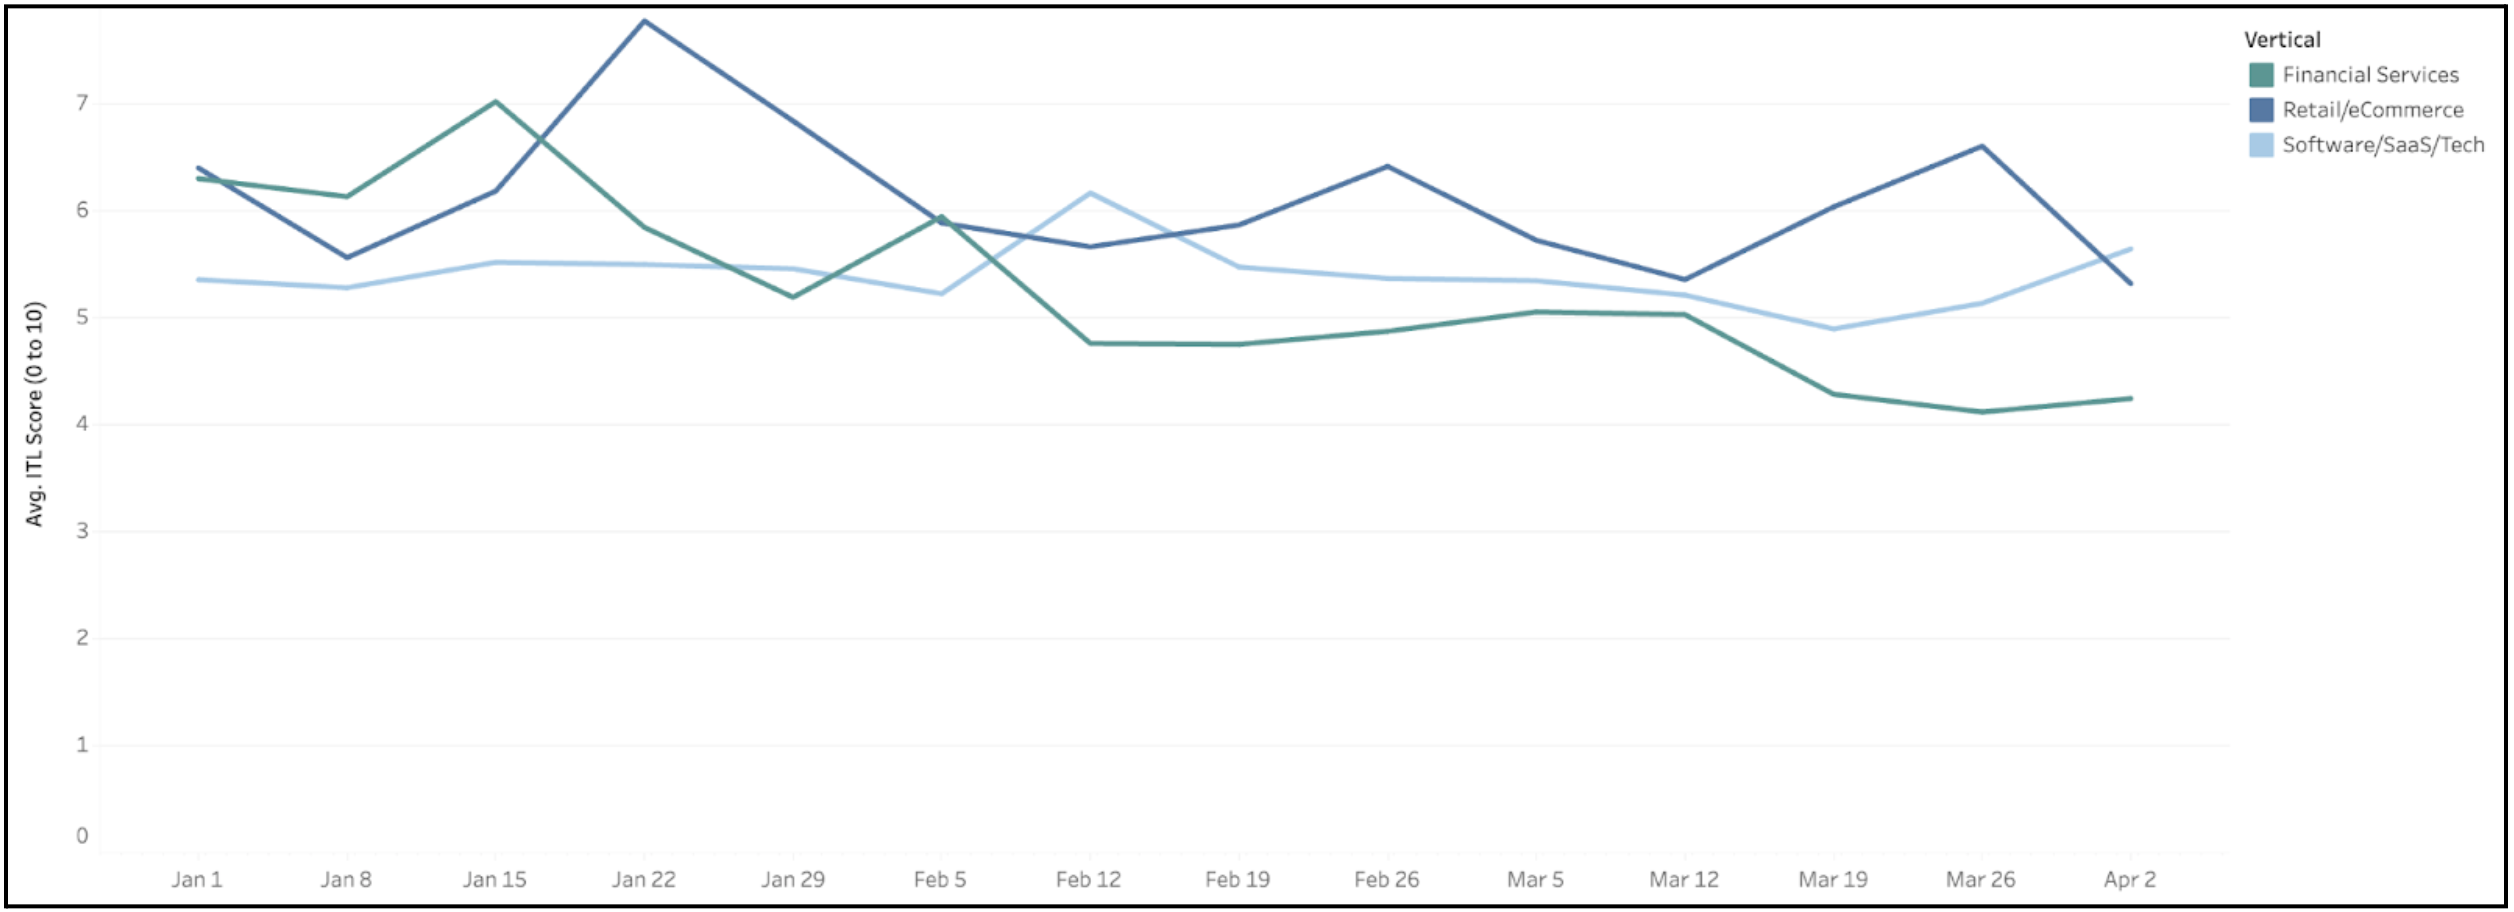
Next, let’s use the ITL to see how the threat of bots varies across industries. In the chart below, we’ve zoomed out to a weekly view to more clearly showcase the general trends in Financial Services, Retail/eCommerce, and Software/SaaS/Tech.
We can see that of the three industries, Retail/eCommerce has experienced the highest peak ITL (nearly 8) and has had an average score of around 6. During the same period, Financial Services peaked at an ITL of 7 but has generally trended downward, while Software/SaaS/Tech has maintained a fairly constant ITL of around 5.5
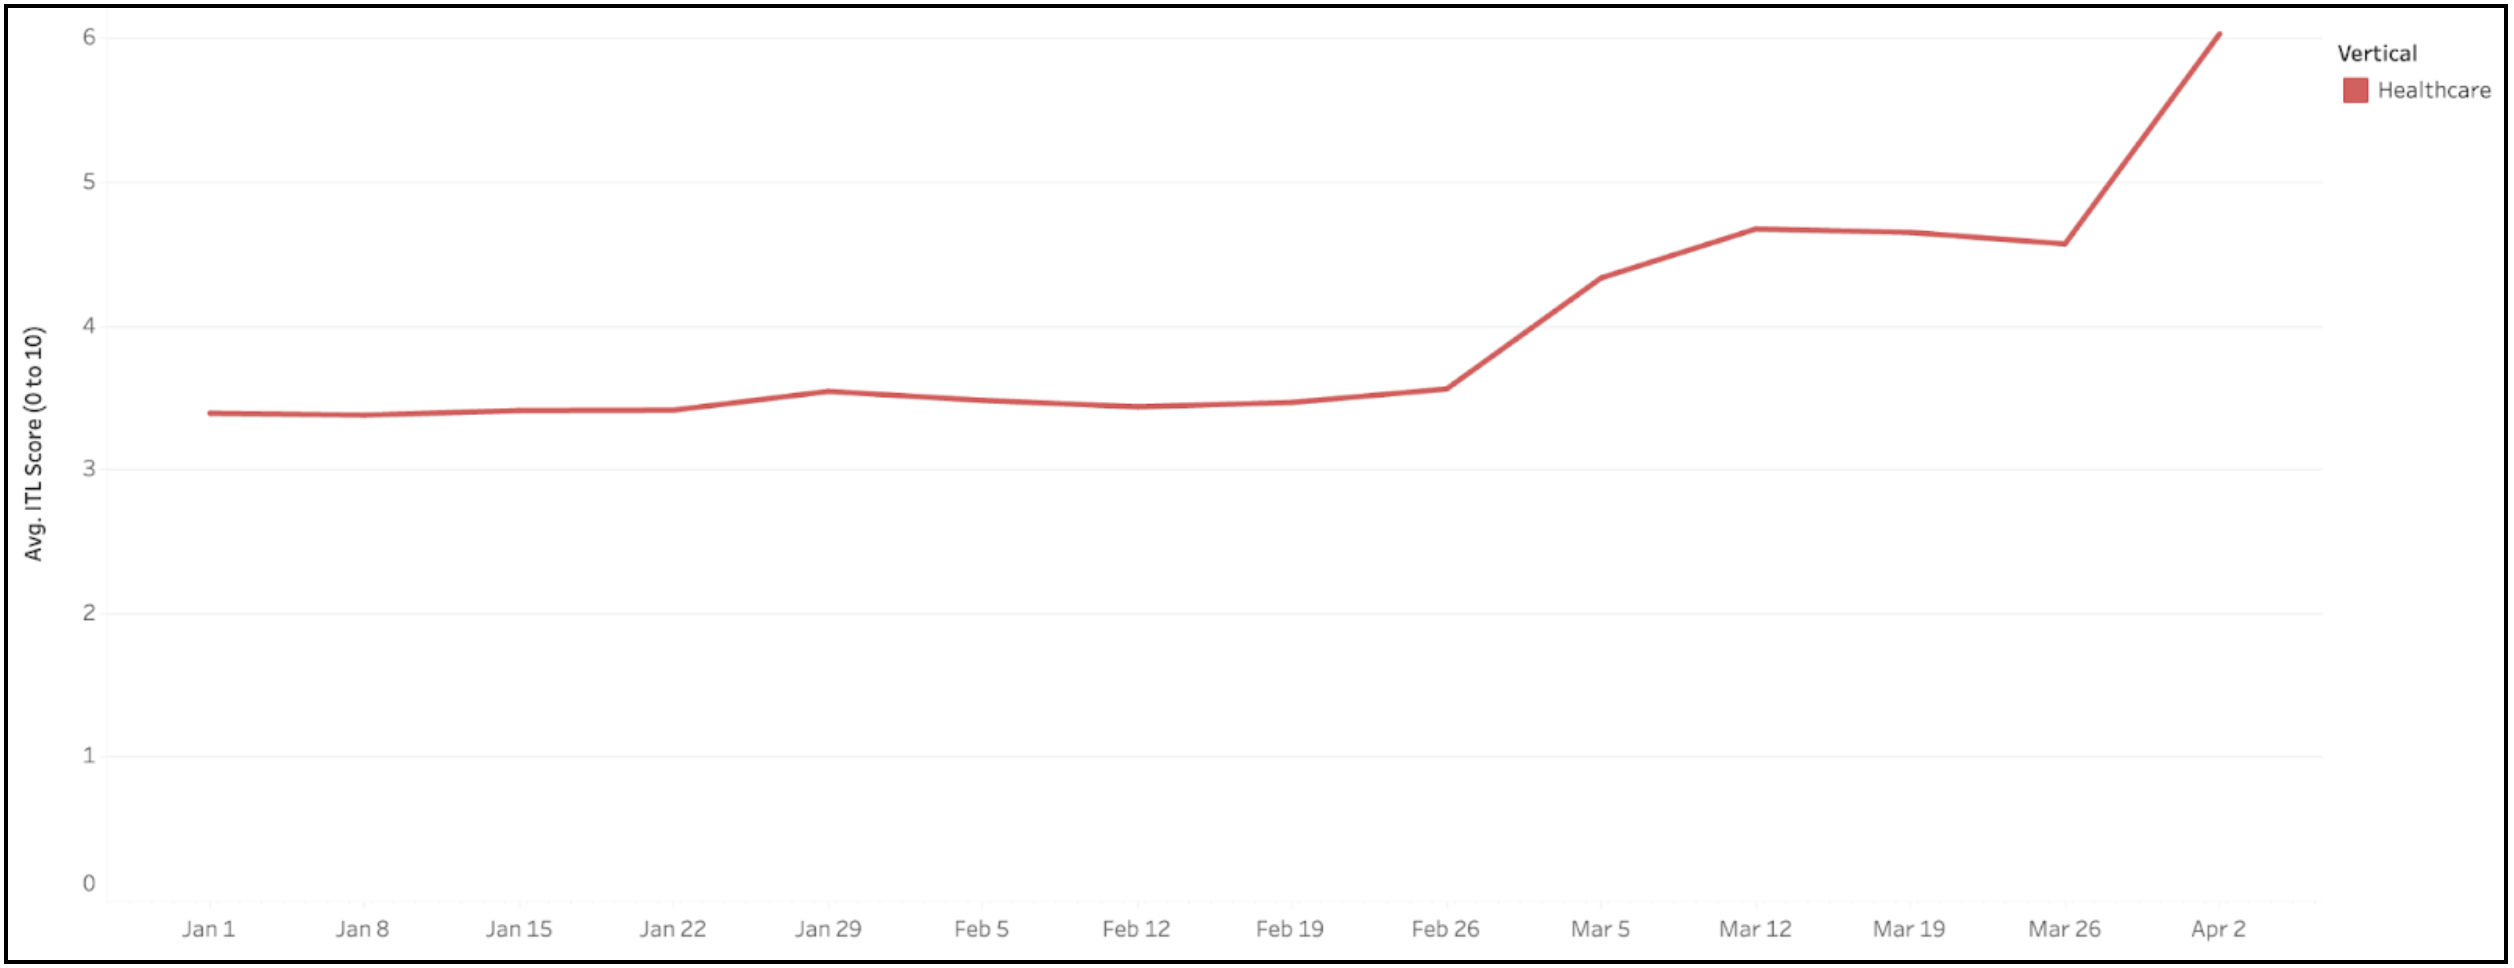
For our third example, let’s shift our attention to Healthcare (with a global aggregation and weekly granularity). It’s clear that around the beginning of March, bot activity targeting the Healthcare industry picked up significantly — jumping from a baseline ITL of around 3.5 to repeated peaks approaching 6.0!
Do providers of Healthcare apps know that they’re under siege — and would they configure their defenses differently if they knew?
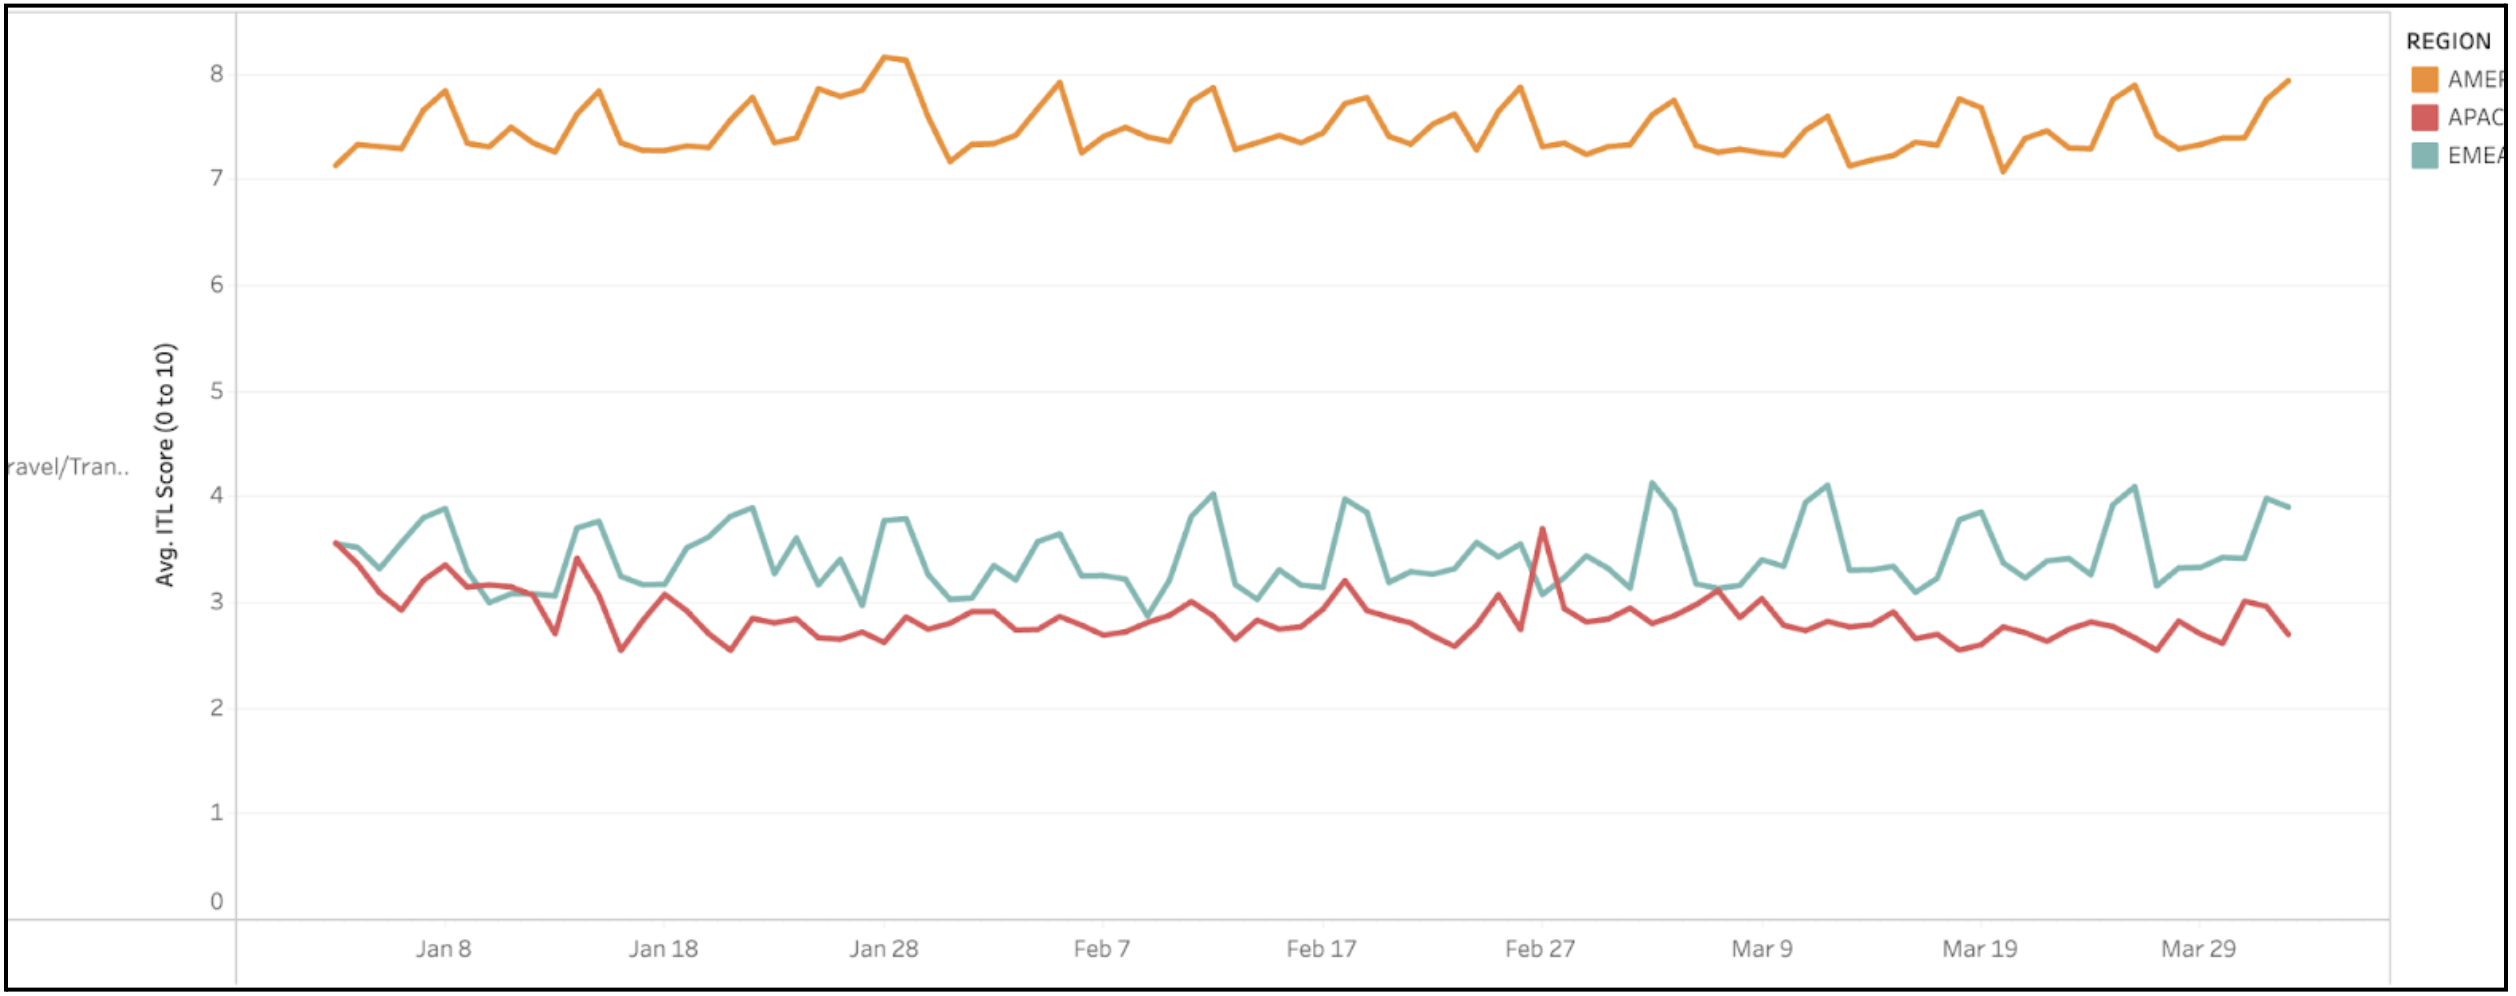
As our final example, let’s return our attention to Travel/Transportation, but this time we’ll go one level deeper and examine the ITL for three different geographies: the Americas (AMER), Asia-Pacific (APAC), and Europe, the Middle East, and Africa (EMEA).
From this breakdown, we can see that while the composite Travel/Transportation ITL tends to be in the range of 5.5 to 6.0, the threat level varies considerably by region: APAC and EMEA are largely in the 3.0 to 4.0 range, while the AMER score has remained above 7.0 for all of 2023!
Looking Ahead
Anonymous firmographic metadata can help us not only to monitor what is happening but also why. As a result, the ITL is about more than just observing attack trends — it’s about surfacing insights and informing actions to protect both providers and users of online services.
At the same time, ITL scores equip the broader security community with data that — until now — has only been available to a handful of organizations.
Ultimately, we’ve really only begun to scratch the surface of the insights that ITL scores can provide, and we invite you to join us on this journey of discovery.
About the author

Catherine Razeto
Staff Data Scientist