If you're a user of both Auth0 and Sumo Logic, you can use this awesome Auth0 extension to send your tenant logs to Sumo Logic. Having all your logs centrally located makes them more valuable and easier to correlate when dealing with something like a security incident or a performance issue. Amazingly, you can sign up for a free Sumo Logic account and collect up to 500MB of data per day! That is more than enough to get started.
“Having all your logs centrally located makes them more valuable and easier to correlate.”
Tweet This
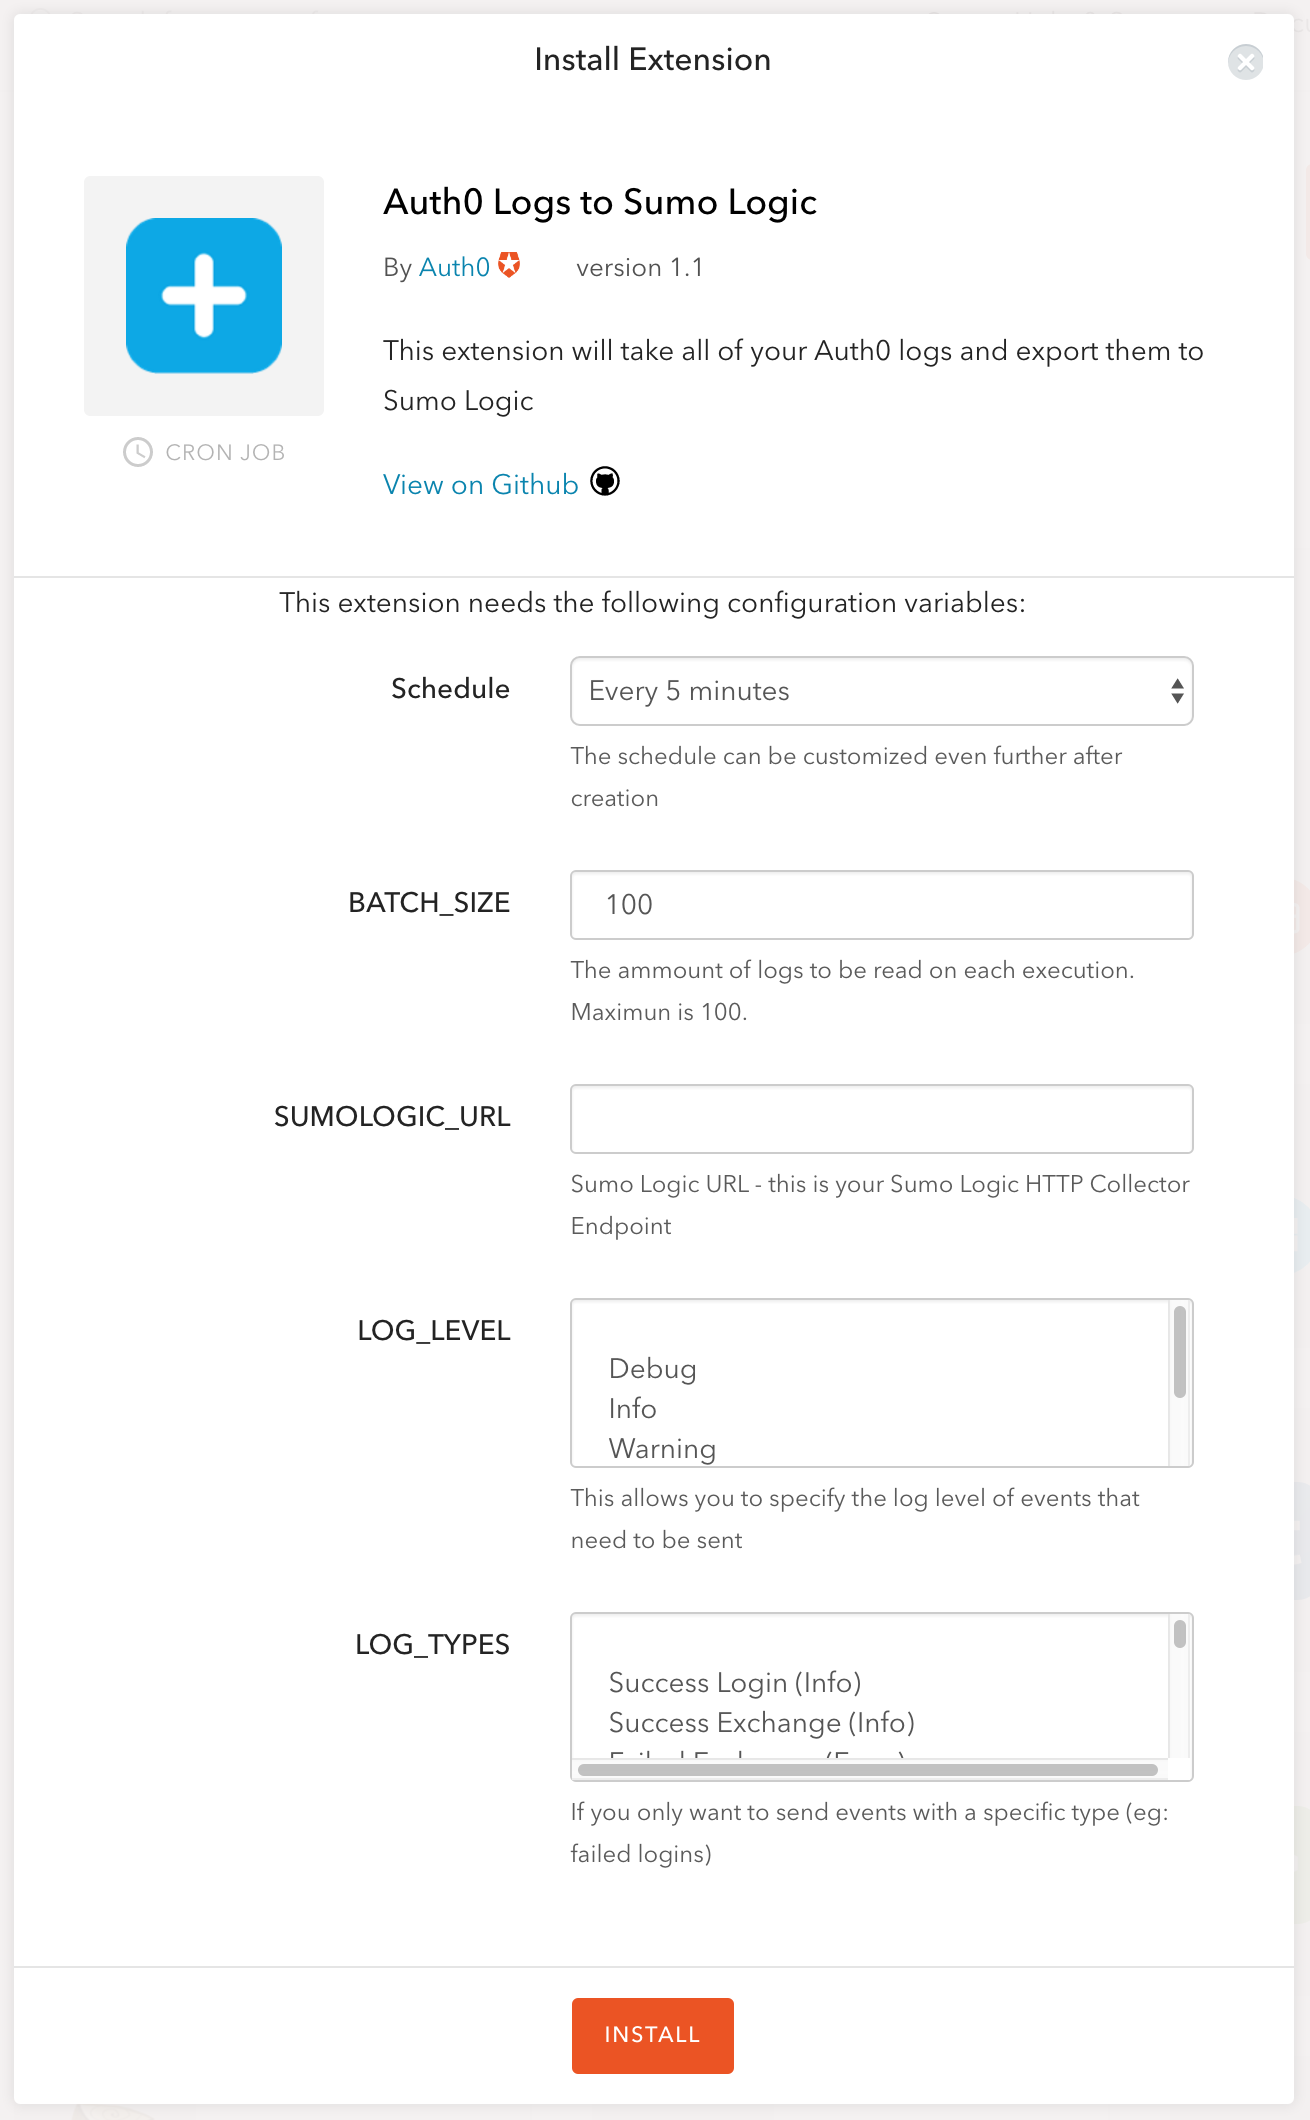
It's super easy to install the "Auth0 Logs to Sumo Logic" extension right from your Auth0 account Dashboard. Simply login, click on Extensions, then find and click on the Sumo Logic icon to configure and enable the extension.
Once enabled, the extension configuration screen will be displayed. You'll need to decide on a few simple settings, but the defaults are all reasonable. One piece of information you will need to supply is the URL of your Sumo Logic HTTP collector endpoint. If you don't already have one, follow the Sumo Logic instructions for creating an HTTP source and paste the URL it generates into the Auth0 extension configuration settings. We recommend naming the source category auth0_logs.
Data should begin appearing in Sumo Logic a few minutes after you enable the extension. A simple search like _sourceCategory=auth0_logs will show you the most recent log events. Getting the top 10 users for a given time period is as easy as this query:
_sourceCategory=auth0_logs | json auto
| count user_name | top 10 user_name by _count
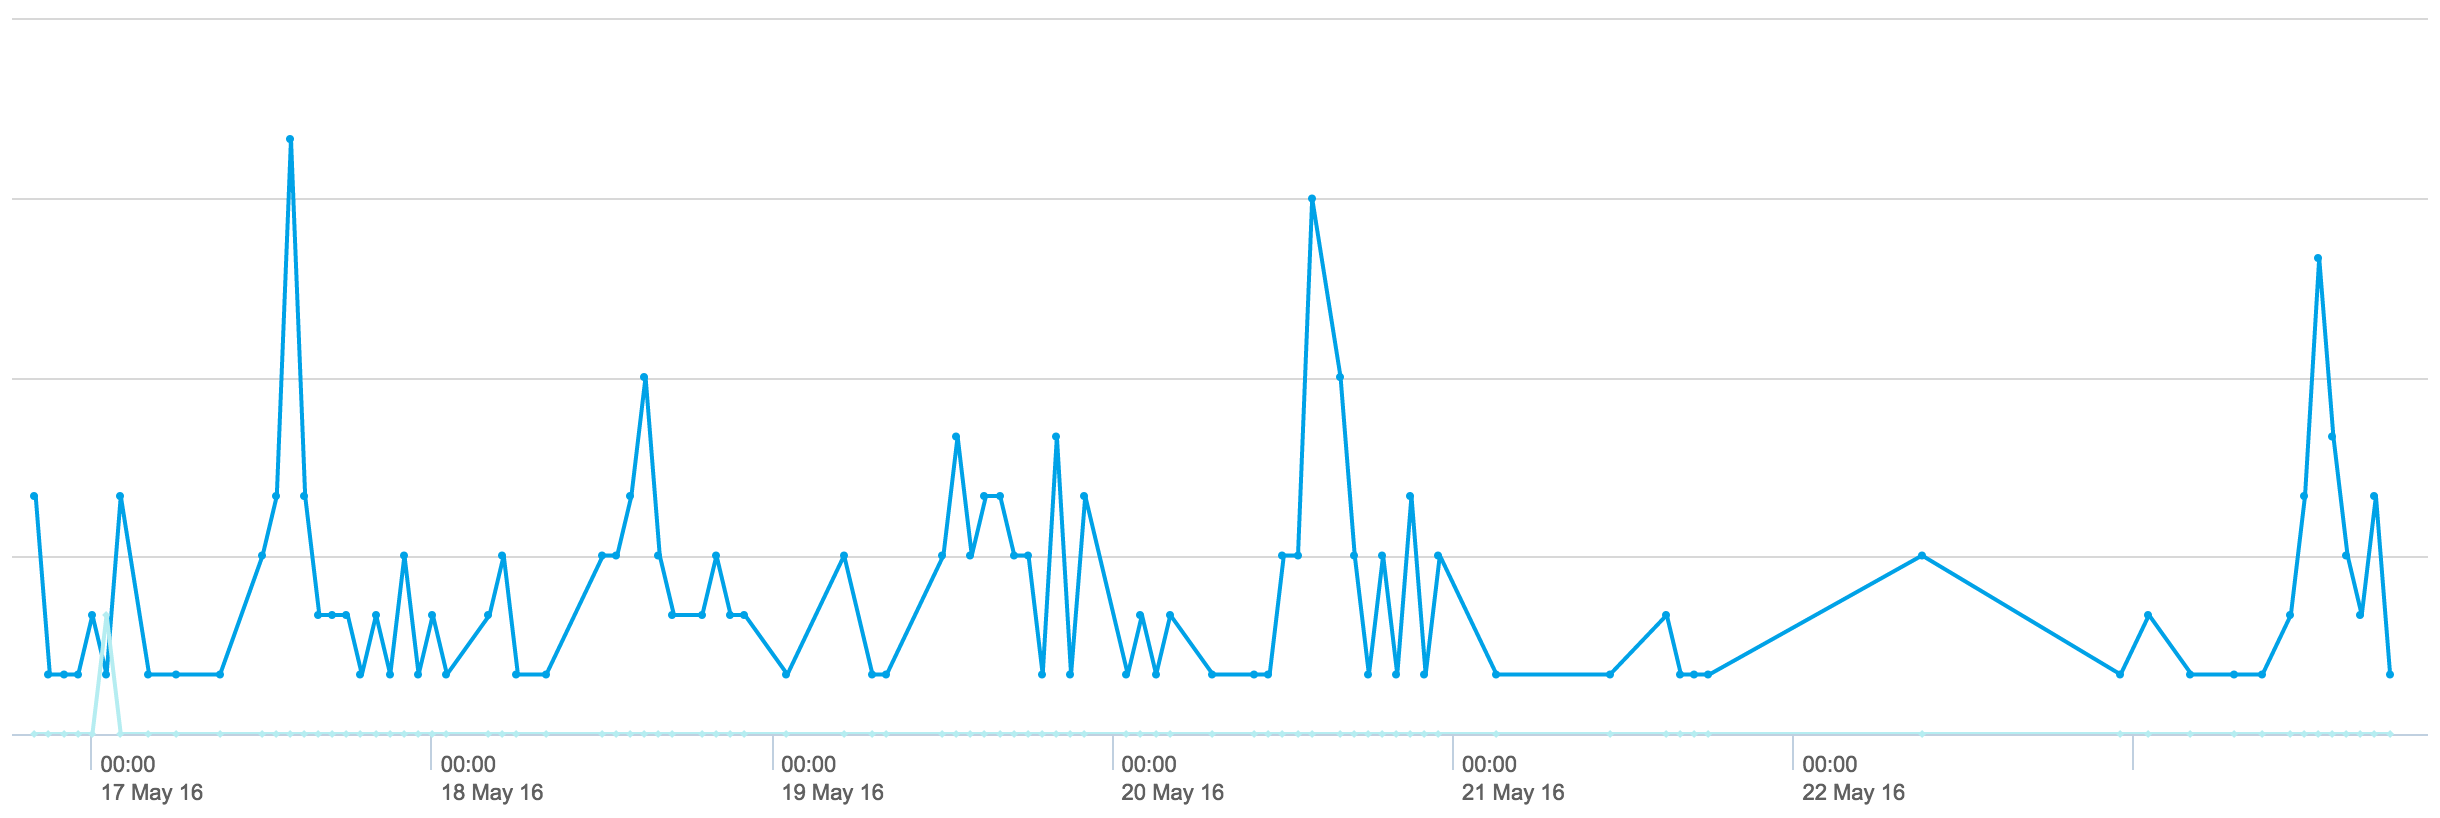
Want to create a chart showing the popularity of a particular client based on the number of logins per hour over a few days? Sure, you can do that in Sumo Logic with just a few commands:
_sourceCategory=auth0_logs salesforce | json auto | timeslice 1h
| count by _timeslice, client_name
| transpose row _timeslice column client_name
The resulting chart will look something like this:
We have been using the Auth0 to Sumo Logic extension ourselves since it was first released, and it's proven to be very useful for staying on top of what's happening with our own Auth0 accounts and our internal users (employees). Sumo Logic makes it easy to see the latest failed logins, find and alert on error messages, create charts to visualize trends, or even do complex statistical analysis on your data.
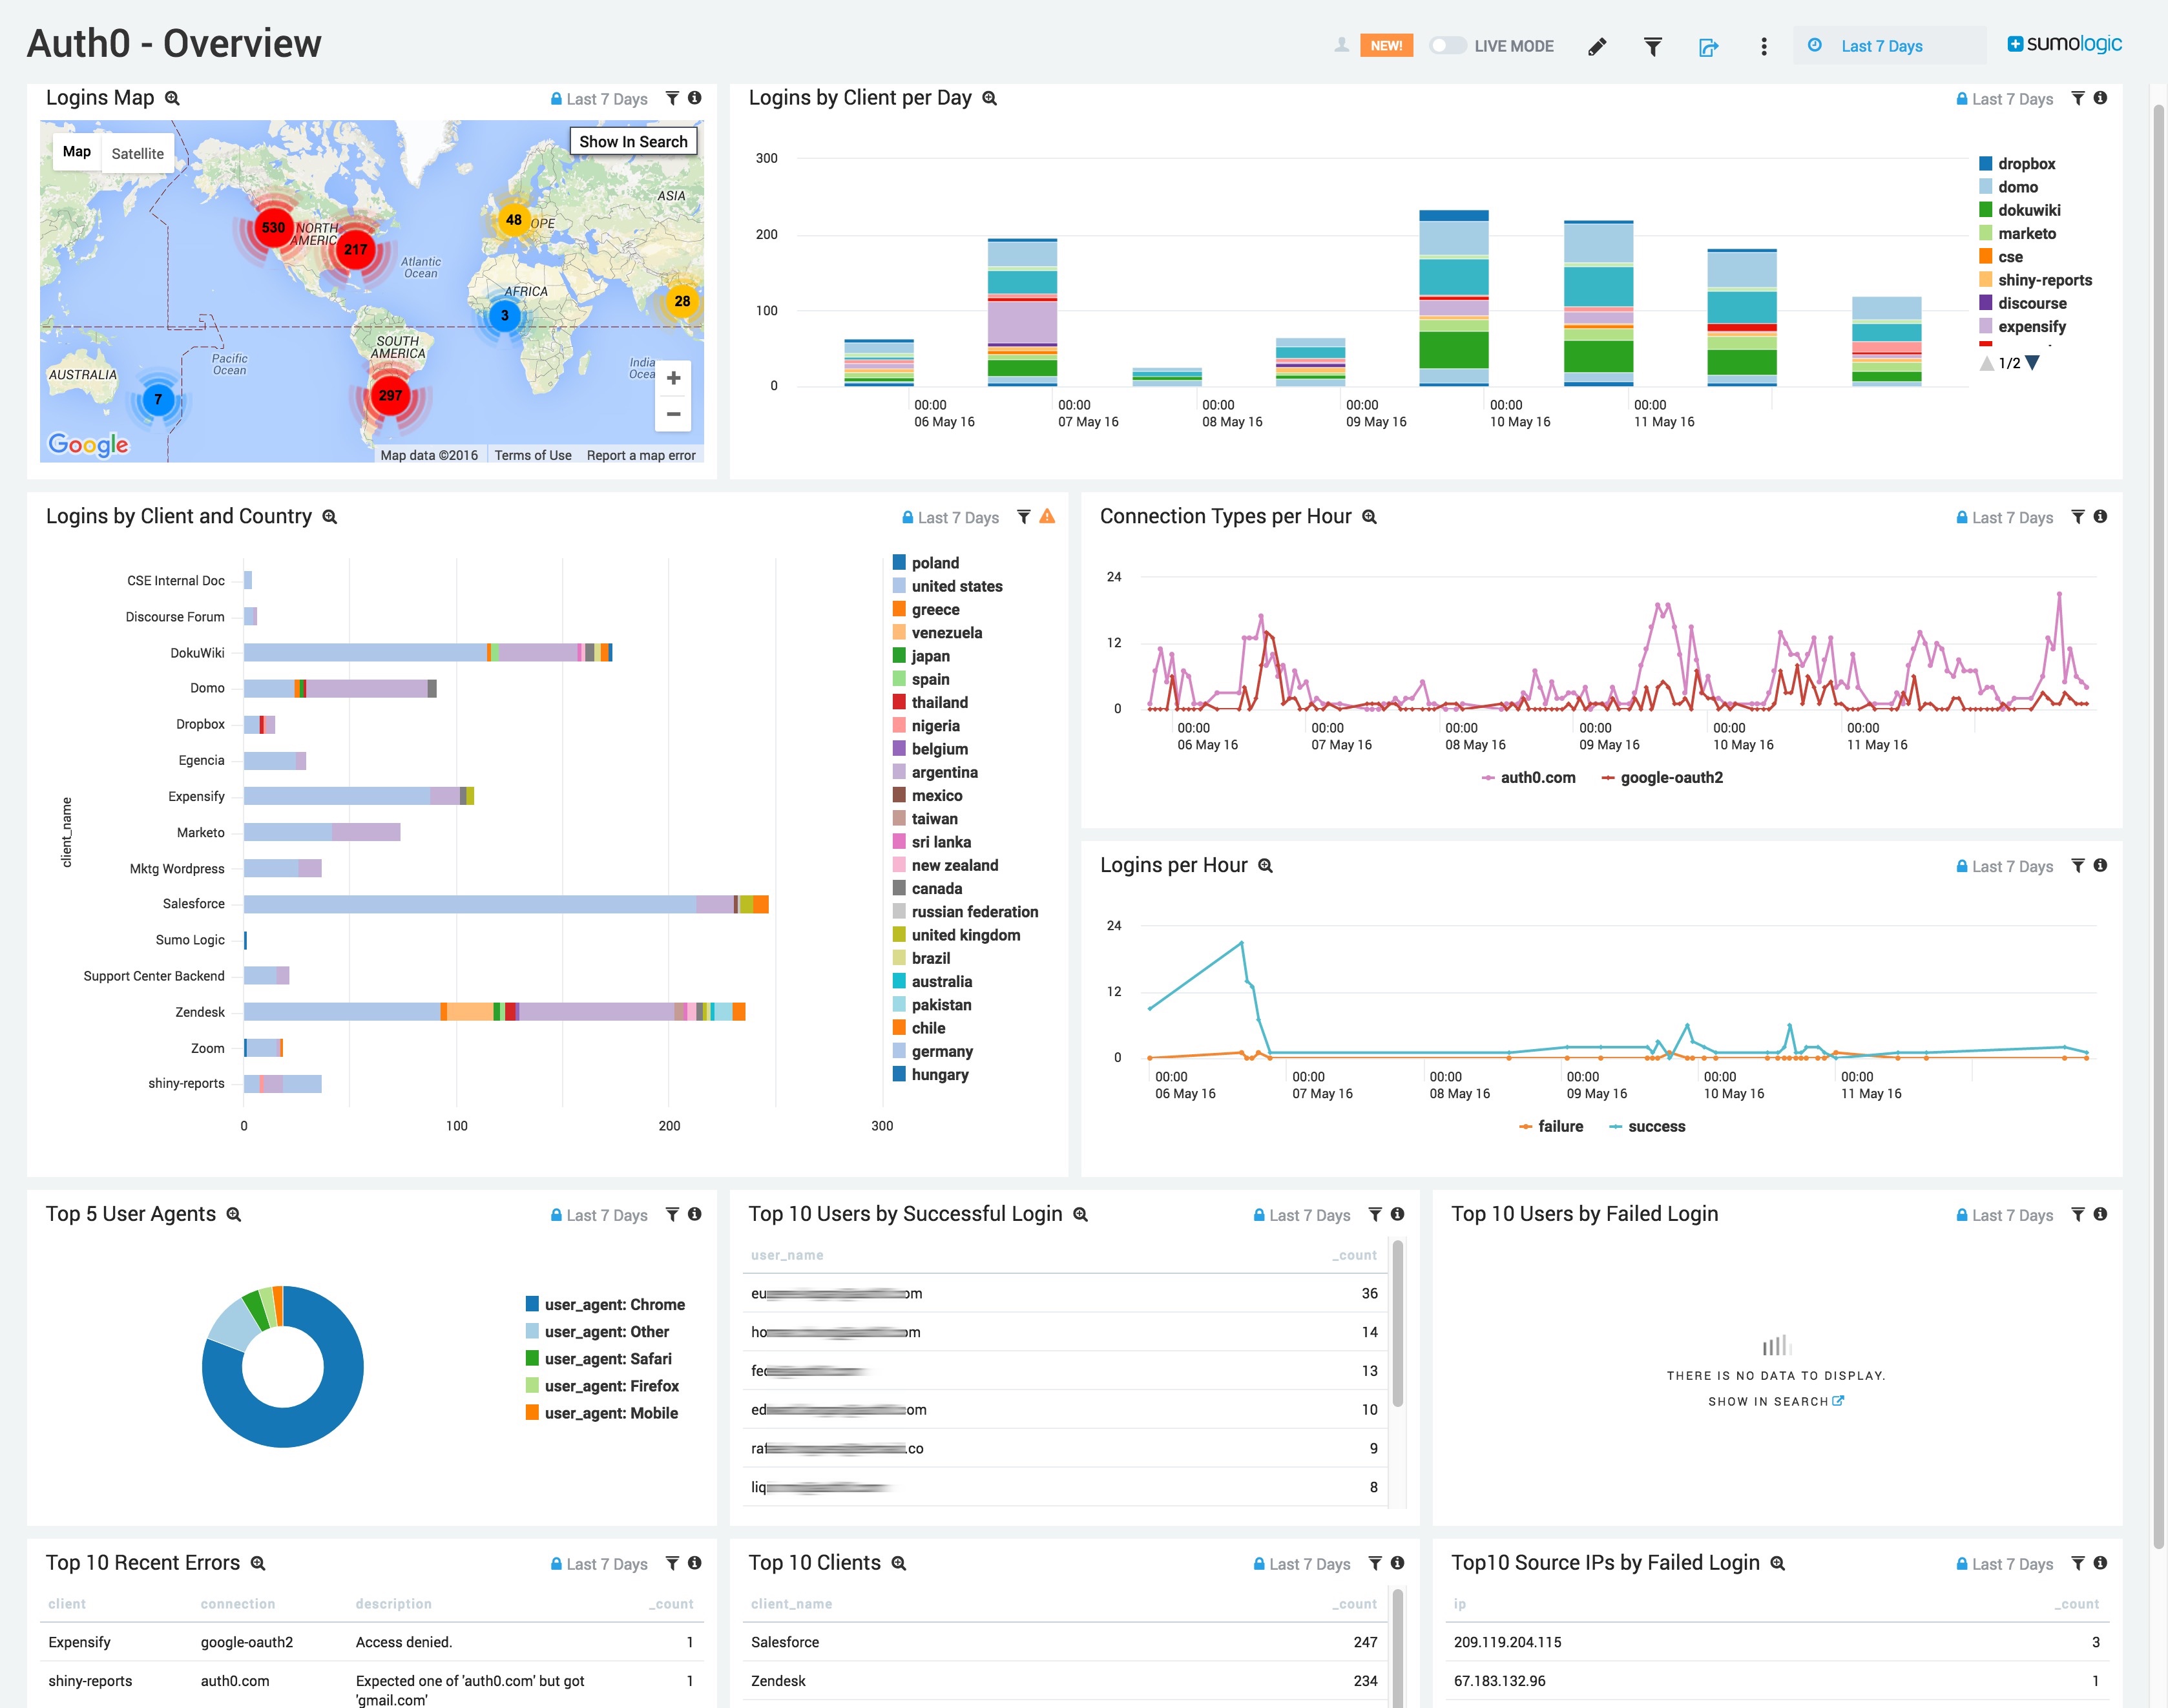
To help us (and our customers) visualize these logs, we spent some time creating a couple of dashboards. The Sumo Logic for Auth0 dashboards show you the output of several saved searches all on one easy to read screen, and makes it easy to zoom in or drill down when something looks interesting.
If you're a Sumo Logic customer and are interested in trying out these dashboards, just let us know via Support Center (be sure to include your Sumo Logic account name) and we will gladly share it with you. Once it's available through your account, you're free to customize it, add to it, create alerts based on the searches, or really anything else that you find useful!
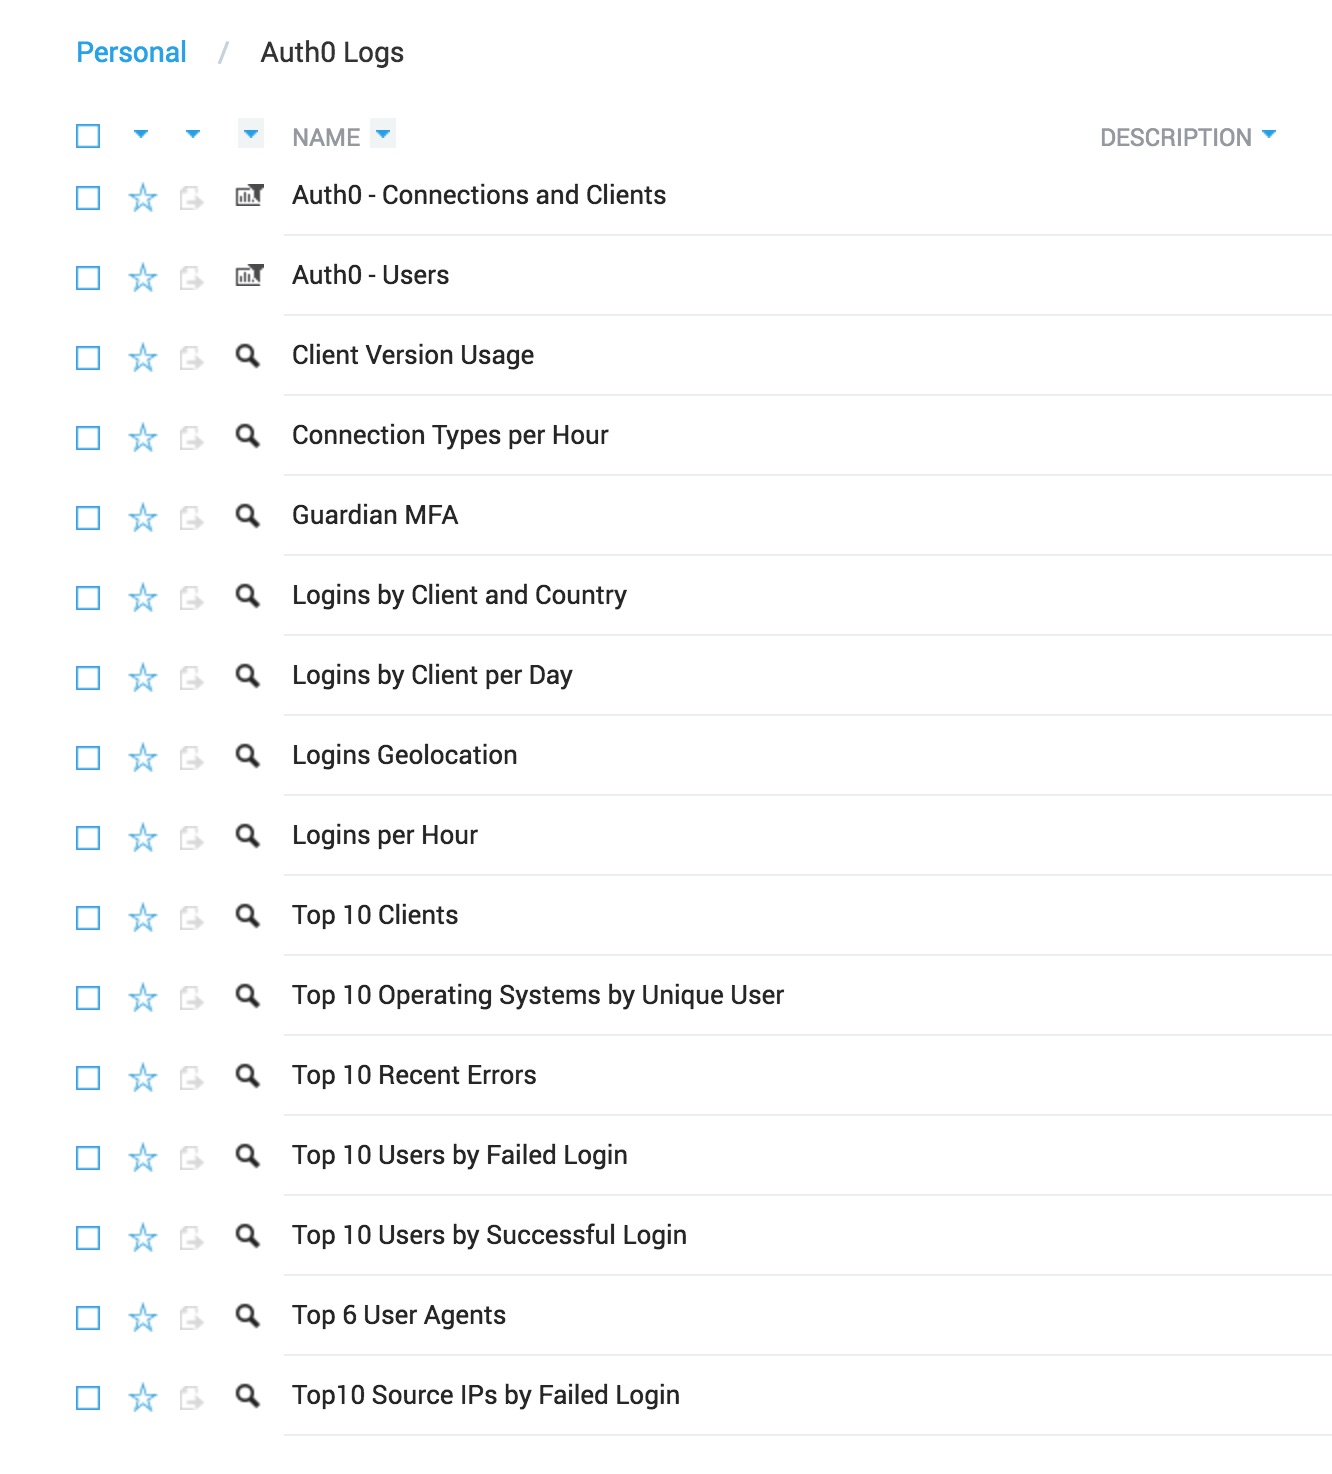
Here are the saved searches we've created so far:
We'd love to hear what you think, especially if you've got a great idea that we should incorporate back into our original version. Our goal is to eventually publish these dashboards via a real Sumo Logic app, so that it's automatically available to all users.
Have fun analyzing and visualizing those logs!


