Learn about Security Center, which provides observability tools that empower you to see potential attack trends and quickly respond to them in real-time.
Security Center provides observability tools that allow you to see potential attack trends and quickly respond to them in real-time. Security Center provides real-time monitoring that allows you to observe your own Customer Identity and Access Management (CIAM) anomaly detection metrics, and lets you configure attack mitigation features from within the same space.
Security Center provides you with an overview of your tenant’s security pulse and allows you to drive outcomes from within the Auth0 Management Dashboard. In Security Center, you can:
Monitor your total traffic and total threats
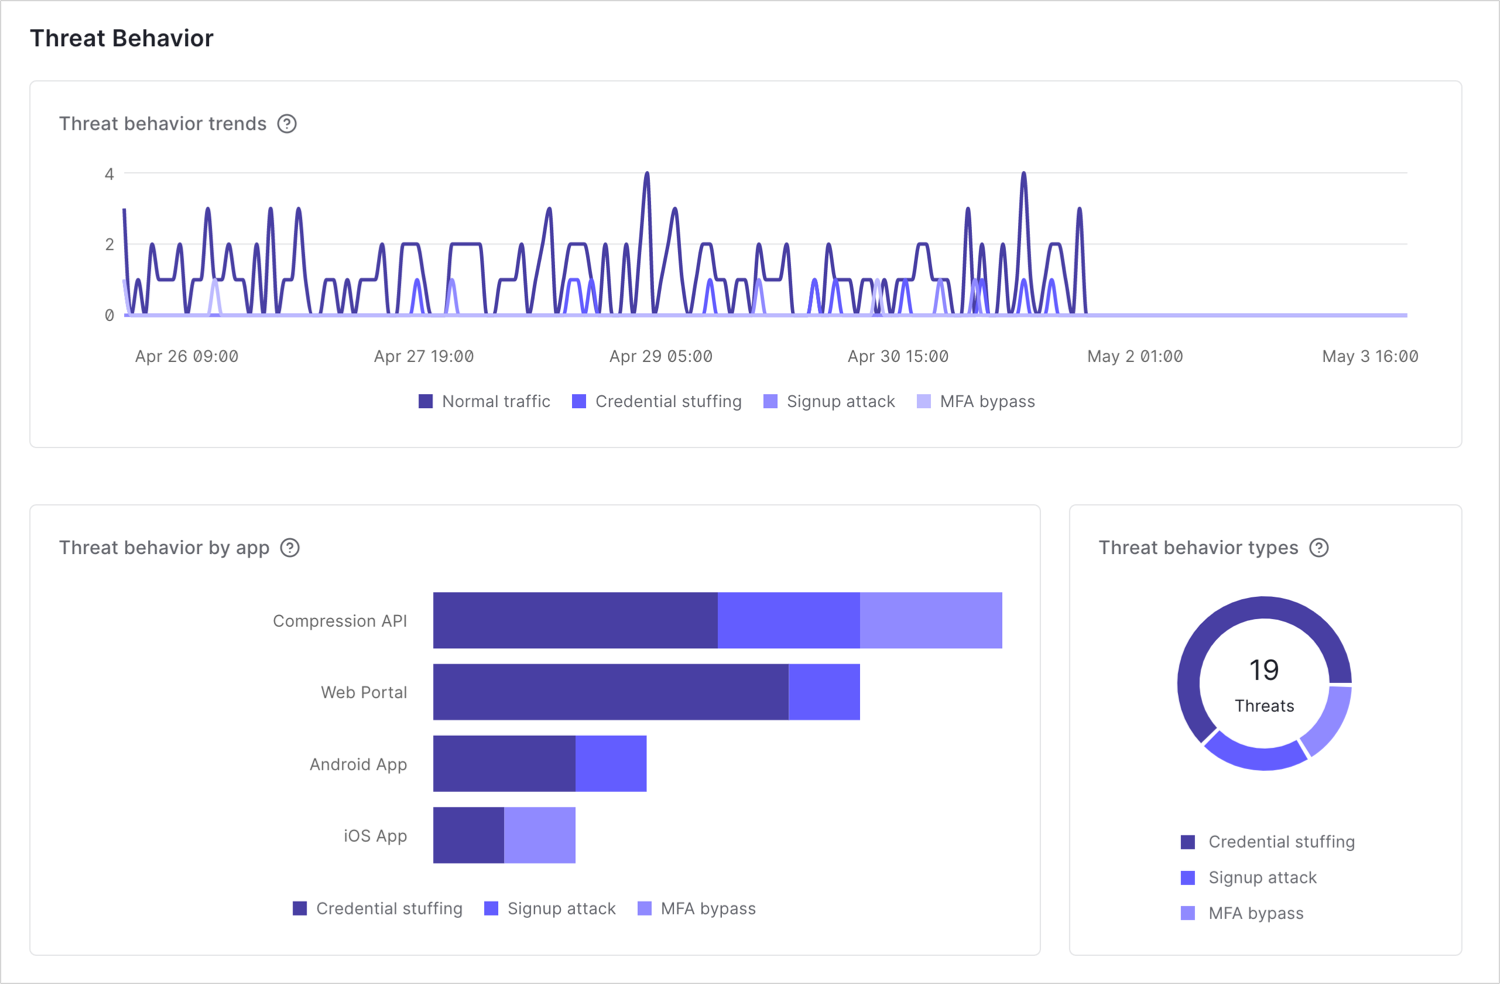
Observe threat behavior trends
Identify applications associated with threat behavior trends
Security Center allows you to observe threat behavior trends for the following threat types:
Credential stuffing: Behavioral patterns that appear to involve a machine attempt with the goal of submitting credentials to compromise user accounts.
Signup attack: Behavioral patterns that appear to involve a machine attempt with the goal of creating new user accounts.
MFA bypass: Behavior patterns that appear to involve a machine attempt with the goal of circumventing user multi-factor authentication (MFA) protections.
Views allow you to slice data by threat type and identify applications associated with threat behavior trends.
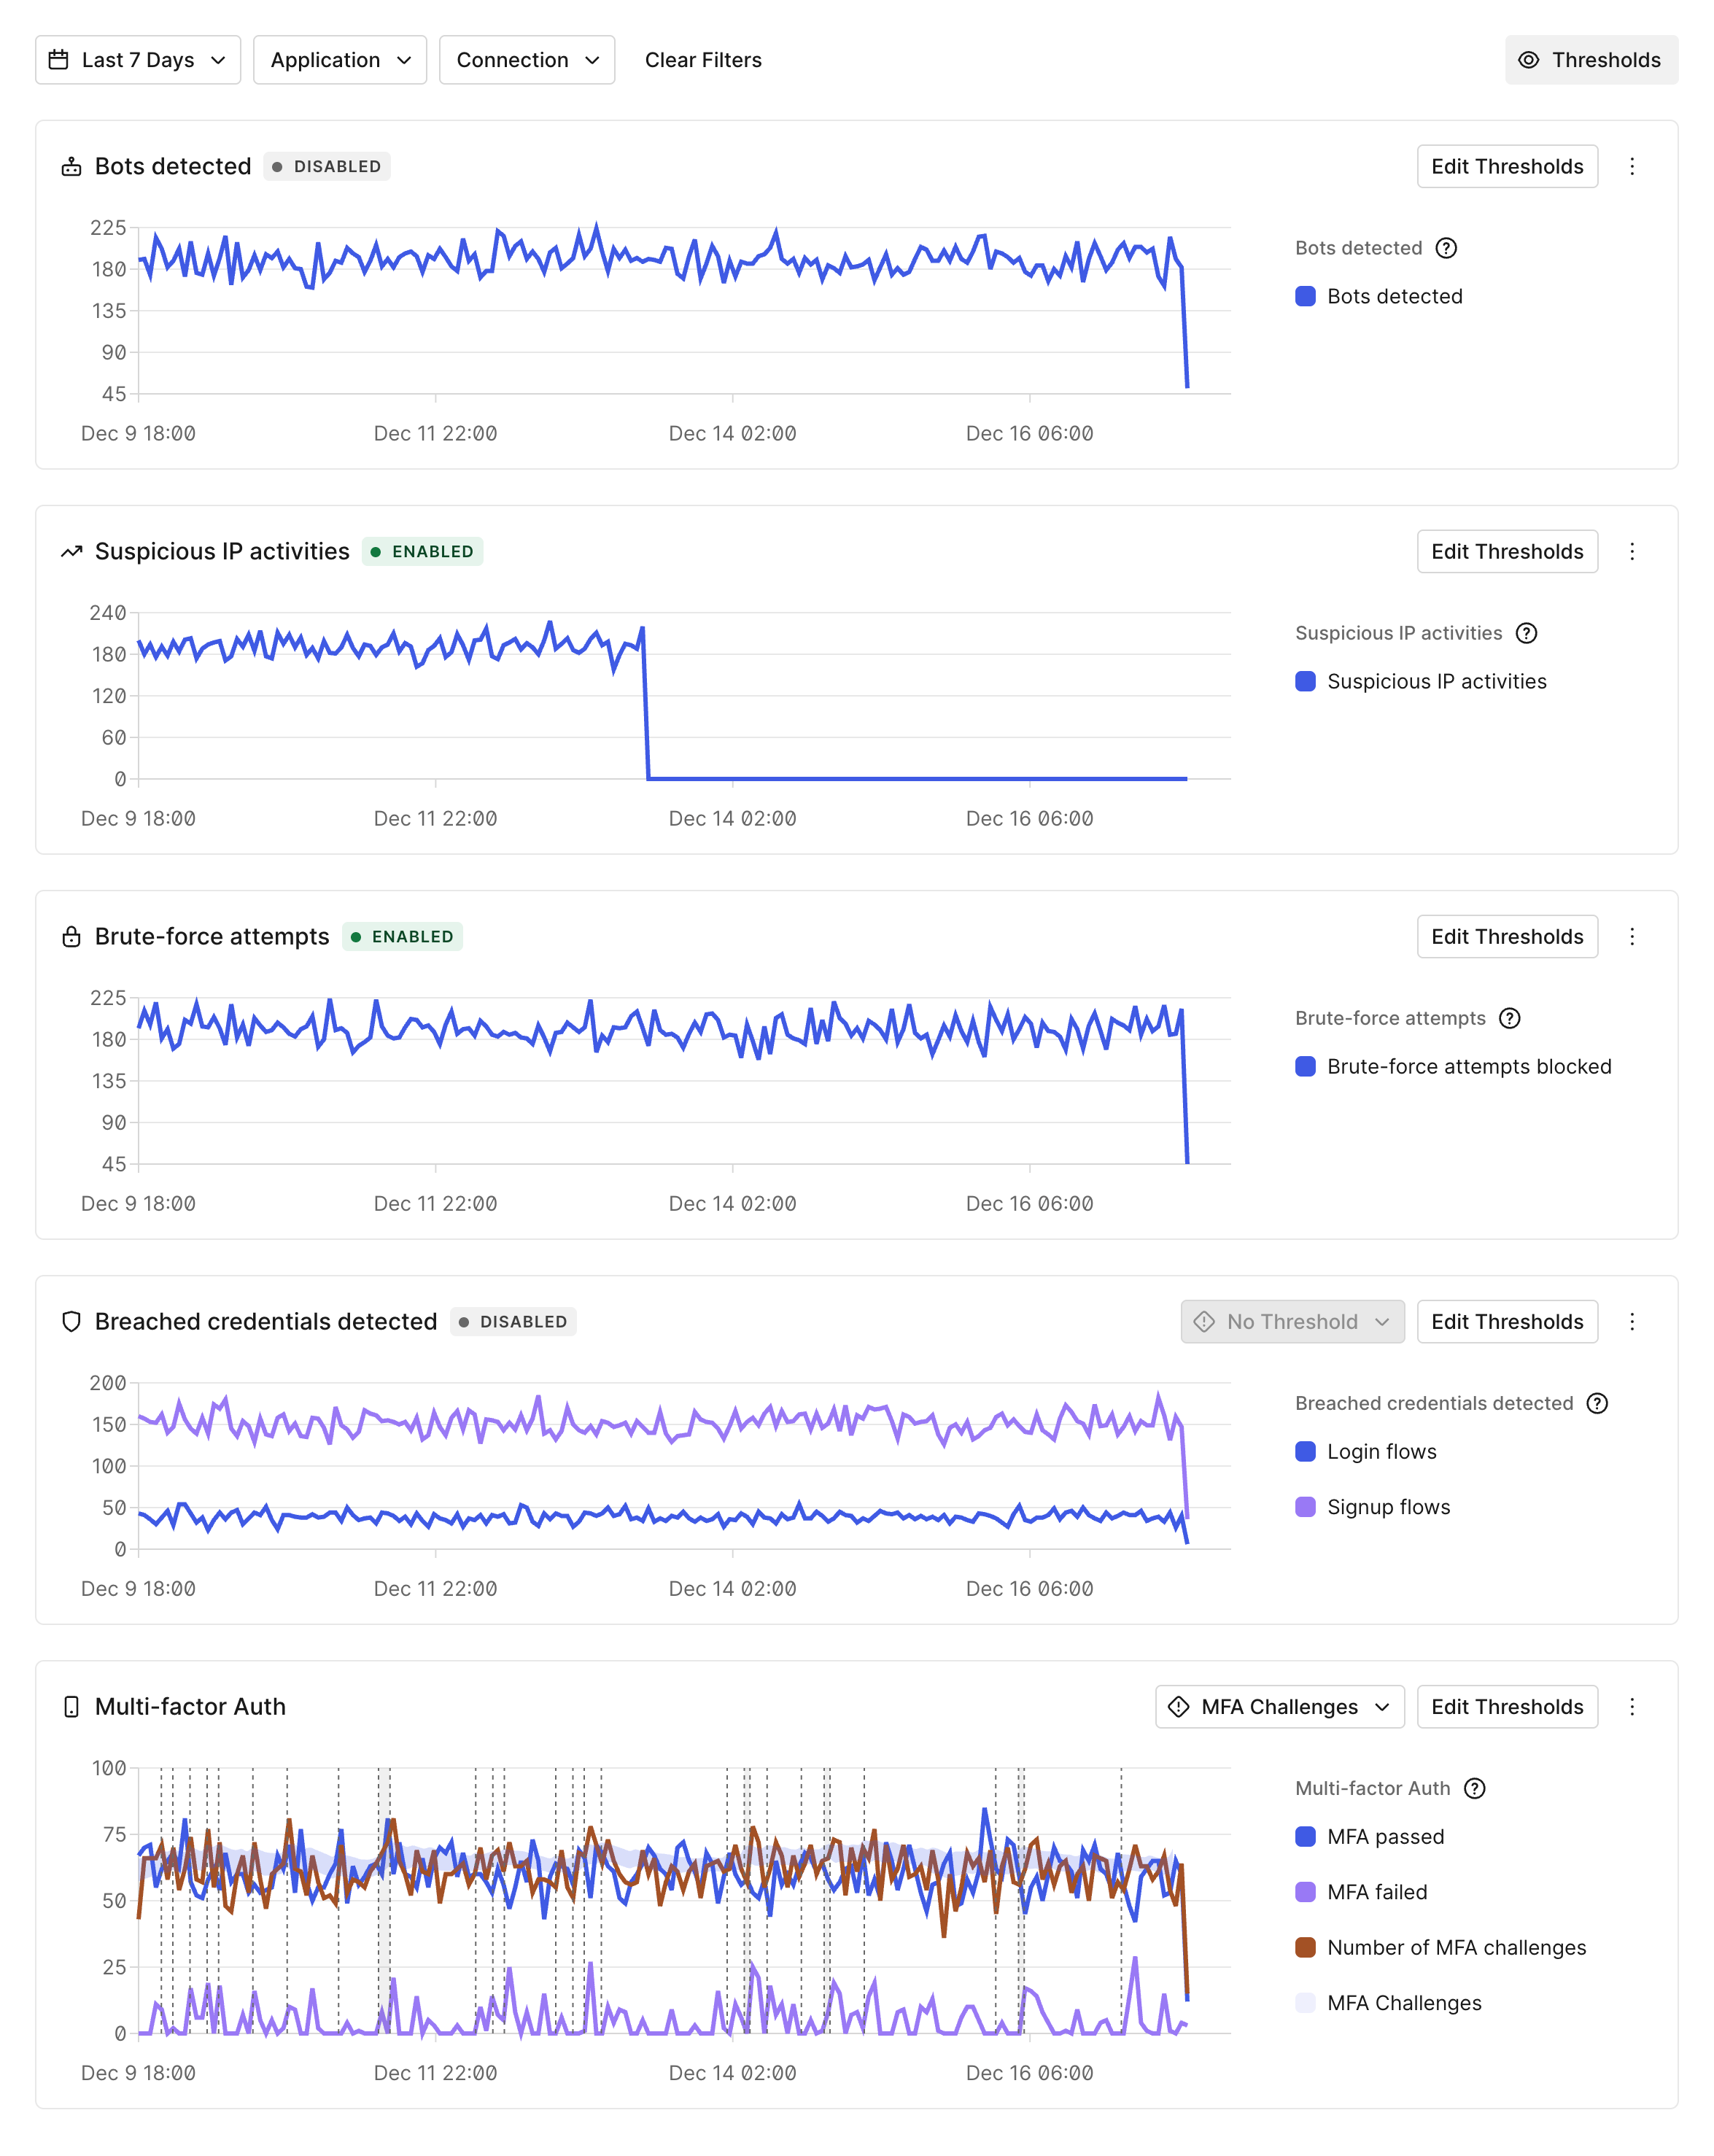
Security Center helps you understand current attack trends identified by our Attack Protection and MFA features, and allows you to implement countermeasures by enabling and configuring these features:
We will identify patterns that are usually an indicator of known attack types and log-related events, regardless of whether you selected countermeasures when configuring our Attack Protection features.
mitigates scripted attacks by detecting when a request is likely to be coming from a bot. Bot detection includes the number of bots detected over the last seven days.To learn more about this feature, read Bot Detection.
blocks traffic from any IP address that rapidly attempts too many logins or signups. Suspicious IP throttling includes the number of suspicious IPs blocked over the last seven days.To learn more about this feature, read Suspicious IP Throttling.
safeguards against a single IP address attacking a single user account. Brute-force protection includes the number of blocked brute-force attempts over the last seven days.To learn more about this feature, read Brute-Force Protection.
protects your applications from signing up or logging in with stolen credentials. Breached password detection includes the number of breached credentials detected in login and signup flows over the last seven days.To learn more about this feature, read Breached Password Detection.
Multi-factor authentication (MFA) verifies users by requiring more than one type of user validation. MFA includes the number of MFA challenges detected and the number of MFA challenges passed or failed over the last seven days.To learn more about this feature, read Multi-Factor Authentication.