- Abnormal bursts in traffic to the login flow that result in errors (such as wrong username or password errors).
- Abnormal bursts in traffic coming from IP locales that are not expected.
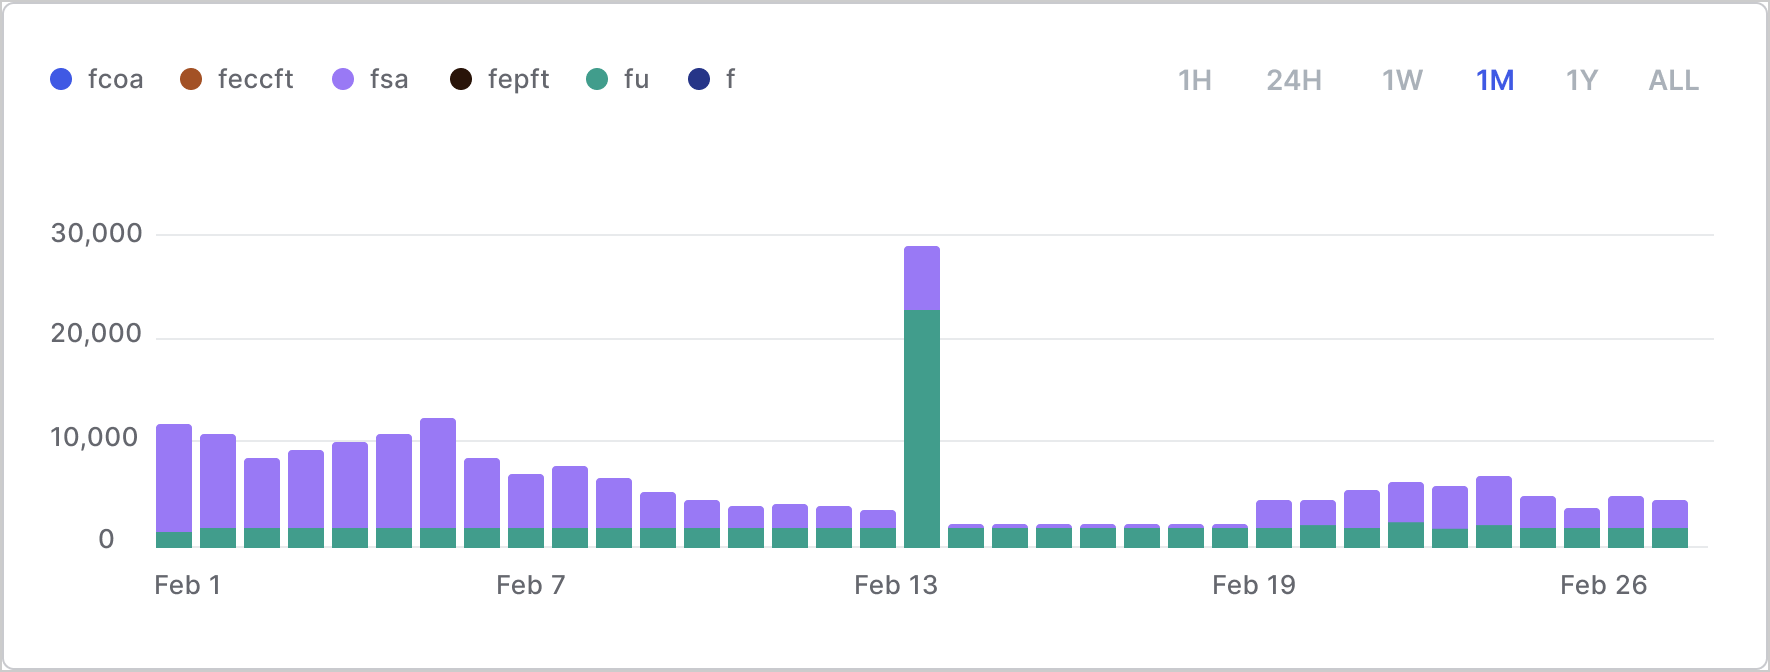
event field to view tenant traffic data. We recommend building a daily histogram of failure events of the following types:
| Event Code | Event |
|---|---|
f | Failed login |
fcoa | Failed cross-origin authentication |
feccft | Failed exchange |
fepft | Failed exchange |
fsa | Failed silent authentication |
fu | Failed login (invalid email/username) |
pla | Pre-login assessment |
sepft | Success exchange |
fu which is a failed username (typical of a credential stuffing attack).
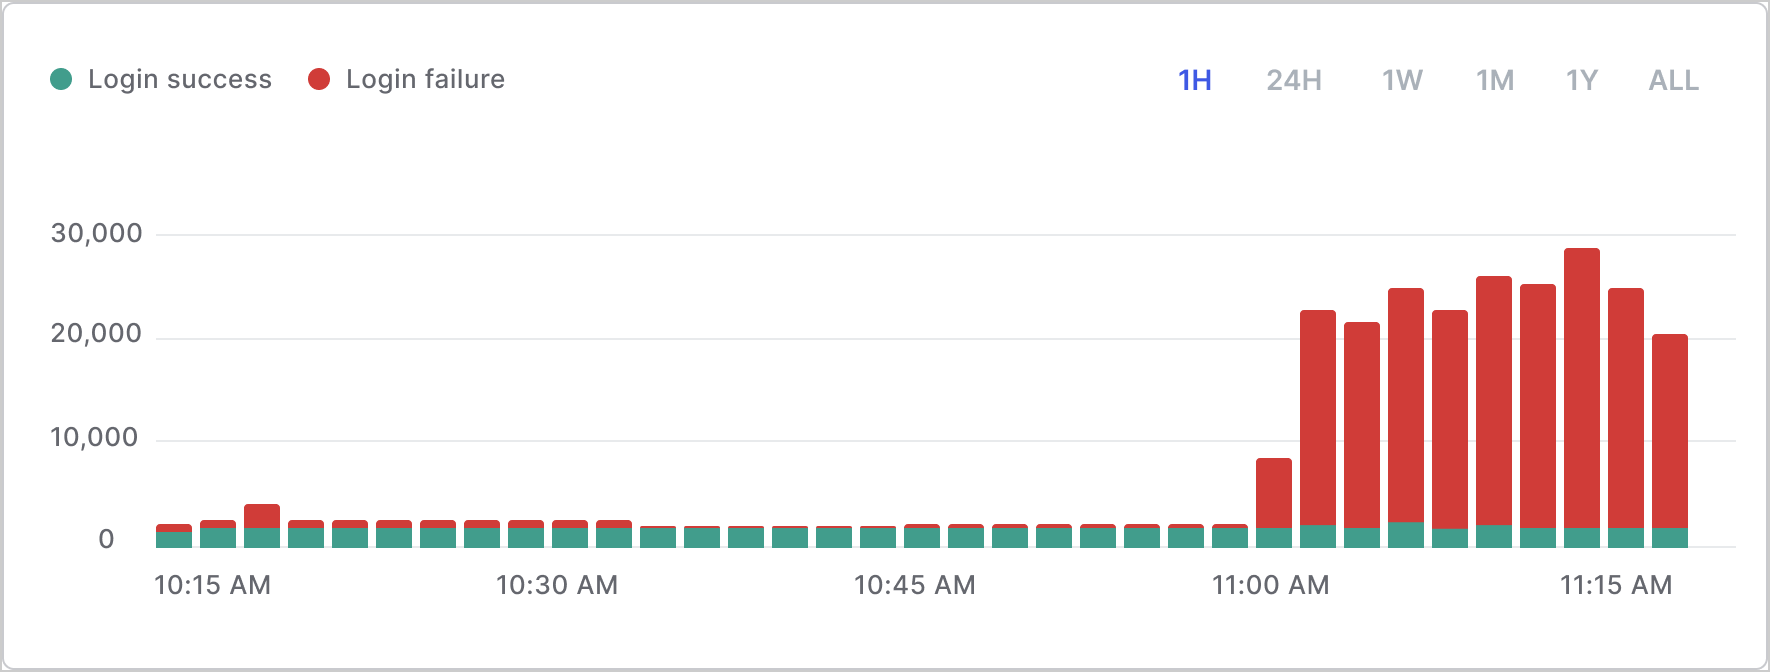
Rate of errors in login flow
Look for a surge or an abnormal number of errors for incorrect username or password. For example: Do you expect >30,000 errors per hour?| Event Code | Event |
|---|---|
s | Login success |
fu | Failed login, invalid email/username |
fp | Failed login, incorrect password |
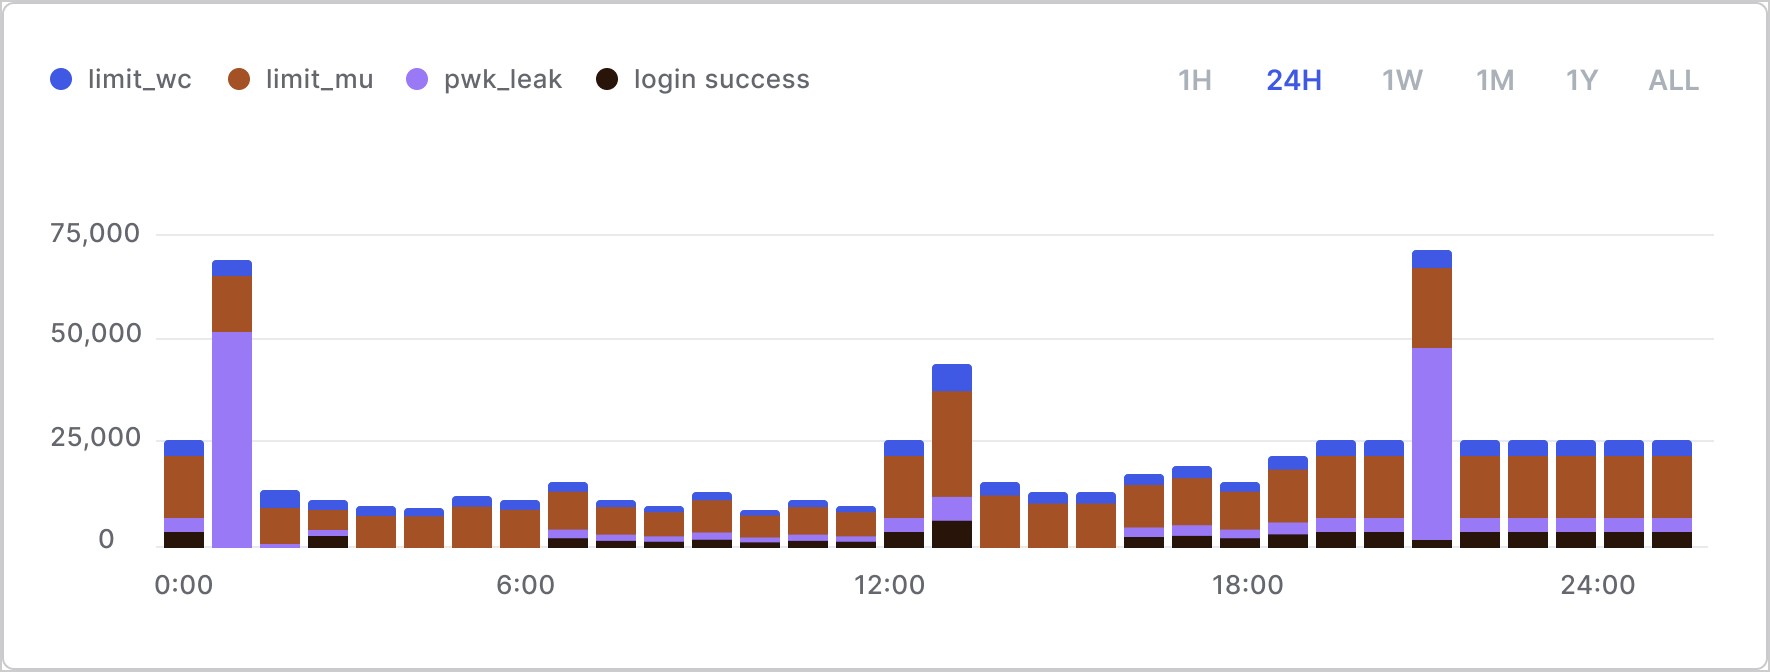
Rate of attack protection events
Look for abnormally high traffic for attack protection events such as or brute-force attacks for multiple accounts.| Event Code | Event |
|---|---|
limit_mu | Blocked IP address |
limit_wc | Blocked account |
pwd_leak | Breached password during login |
signup_pwd_leak | Breached password during signup |
reset_pwd_leak | Breached password during password recovery |
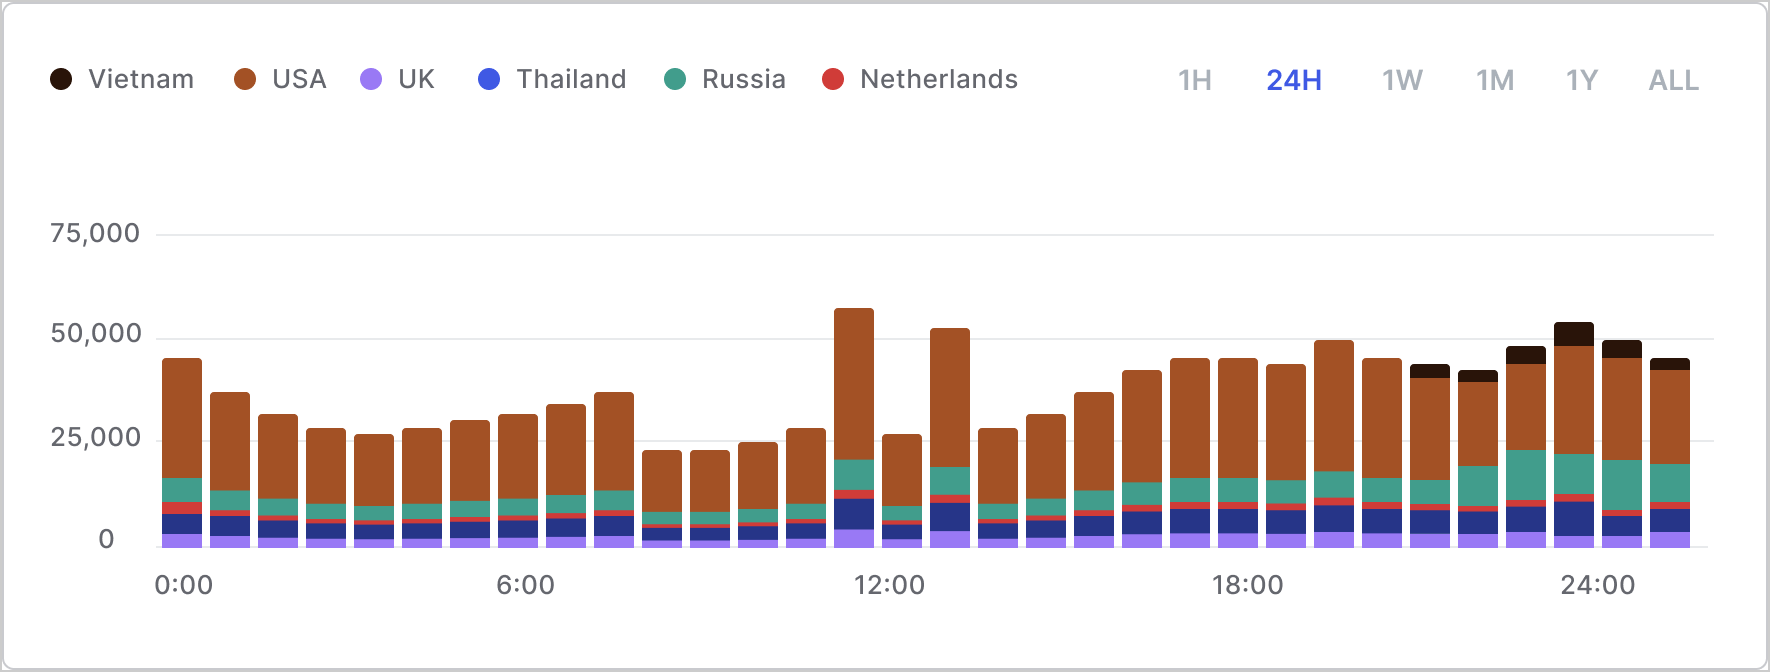
Number of IPs producing errors and their locations
Look for a high number of IPs from locales that do not make sense. For example: Do you expect traffic from 10,000 IPs from Russia every day? Observeip address data in conjunction with fu event traffic to determine where the failure traffic is coming from.
IP geolocation data isn’t available in the tenant logs unless you’re able to enrich it from another location. The IP locale is only available from Kibana where the logs are already enriched with the information.
Here’s an example of what the data might look like: