Debug Rules

To debug any Auth0 Rule you have created, you can use console.log from within your rule code. You can see console.log output by using the Save and Try, viewing the logs available with the Real-time Webtask Logs extension, or for legacy clients, using the Debug Rule CLI.
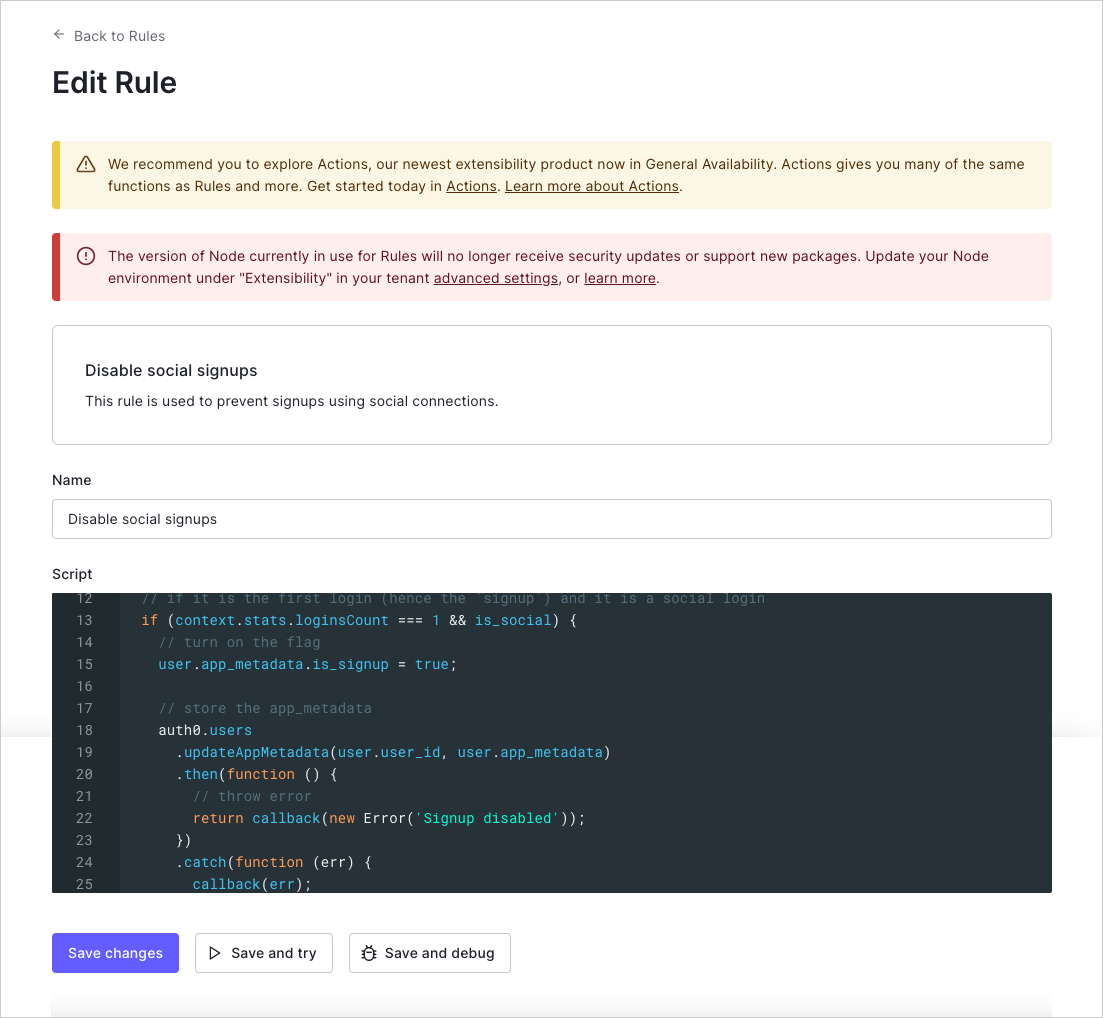
Dashboard - Auth Pipeline - Rules - Edit Rule

Try this Rule

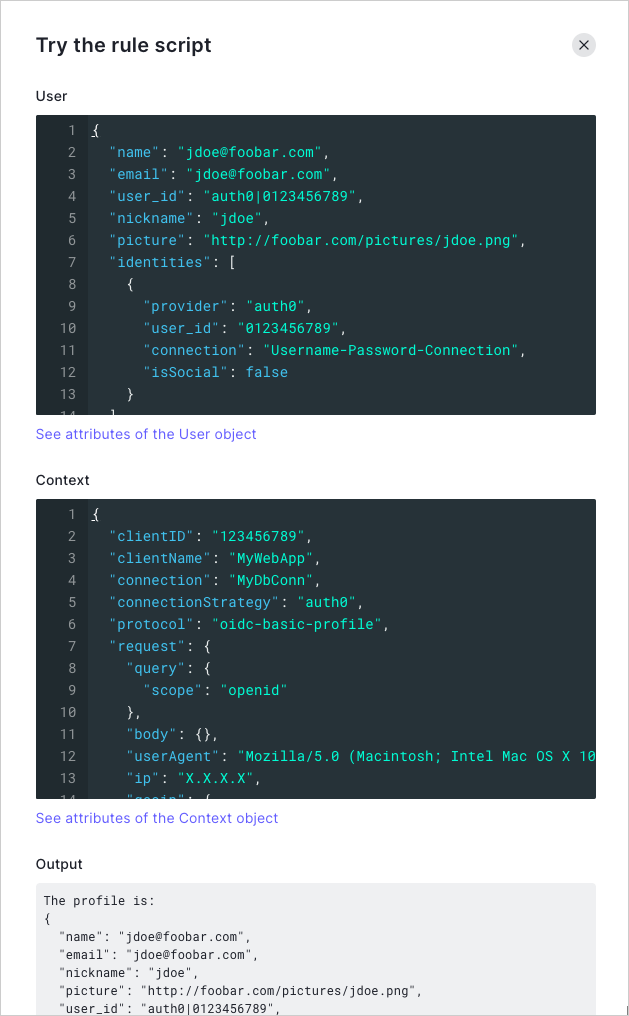
In the Rules Editor, the Save and Try button lets you run a Rule in isolation with mock user and context objects. Clicking TRY will run the Rule with those two objects as input and will display any console.log output.

The Try this rule script feature functions outside a specific client context. When using this feature, you may run into issues if your Rule depends on data that would be provided when called from an actual application.

Auth0 Pipeline - Rules - Try this rule

Real-time logs extension

The Real-time Webtask Logs extension displays all logs in real-time for all custom code in your account, which includes all console.log output and exceptions. To learn more, read Real-time Webtask Logs.

Debug Rule CLI

In the Rules Editor, the Save and Debug option displays instructions for installing, configuring, and running the webtask CLI for debugging Rules. Paste these commands into a terminal to see the console.log output and any unhandled exceptions that occur during Rule execution.

For example:

~  npm install -g wt-cli
  ~  wt init --container "youraccount" --url "https://sandbox.it.auth0.com" --token "eyJhbGci...WMPGI" -p "youraccount-default-logs"
  ~  wt logs -p "youraccount-default-logs"
  [18:45:38.179Z]  INFO wt: connected to streaming logs (container=youraccount)
  [18:47:37.954Z]  INFO wt: webtask container assigned
  [18:47:38.167Z]  INFO wt: ---- checking email_verified for some-user@mail.com! ----

Was this helpful?

/

This debugging method works for Rules tried from the Dashboard and for those actually running during user authentication.