TL;DR: In this tutorial, I'll show you how an API gateway can collect application specific metrics for you. You can get the code example in this GitHub repository.
Introduction
Unless you're building a proof of concept or an application that's not aiming to reach production, you definitely want to add monitoring and metrics to your system. In this installment, we're going to look how Express Gateway can help you to add application specific metrics and expose them through an HTTP endpoint that can be queried by an external service, such as Prometheus.
“Monitoring and metrics are an important part of your system.”
Tweet This
Express Gateway to Rescue
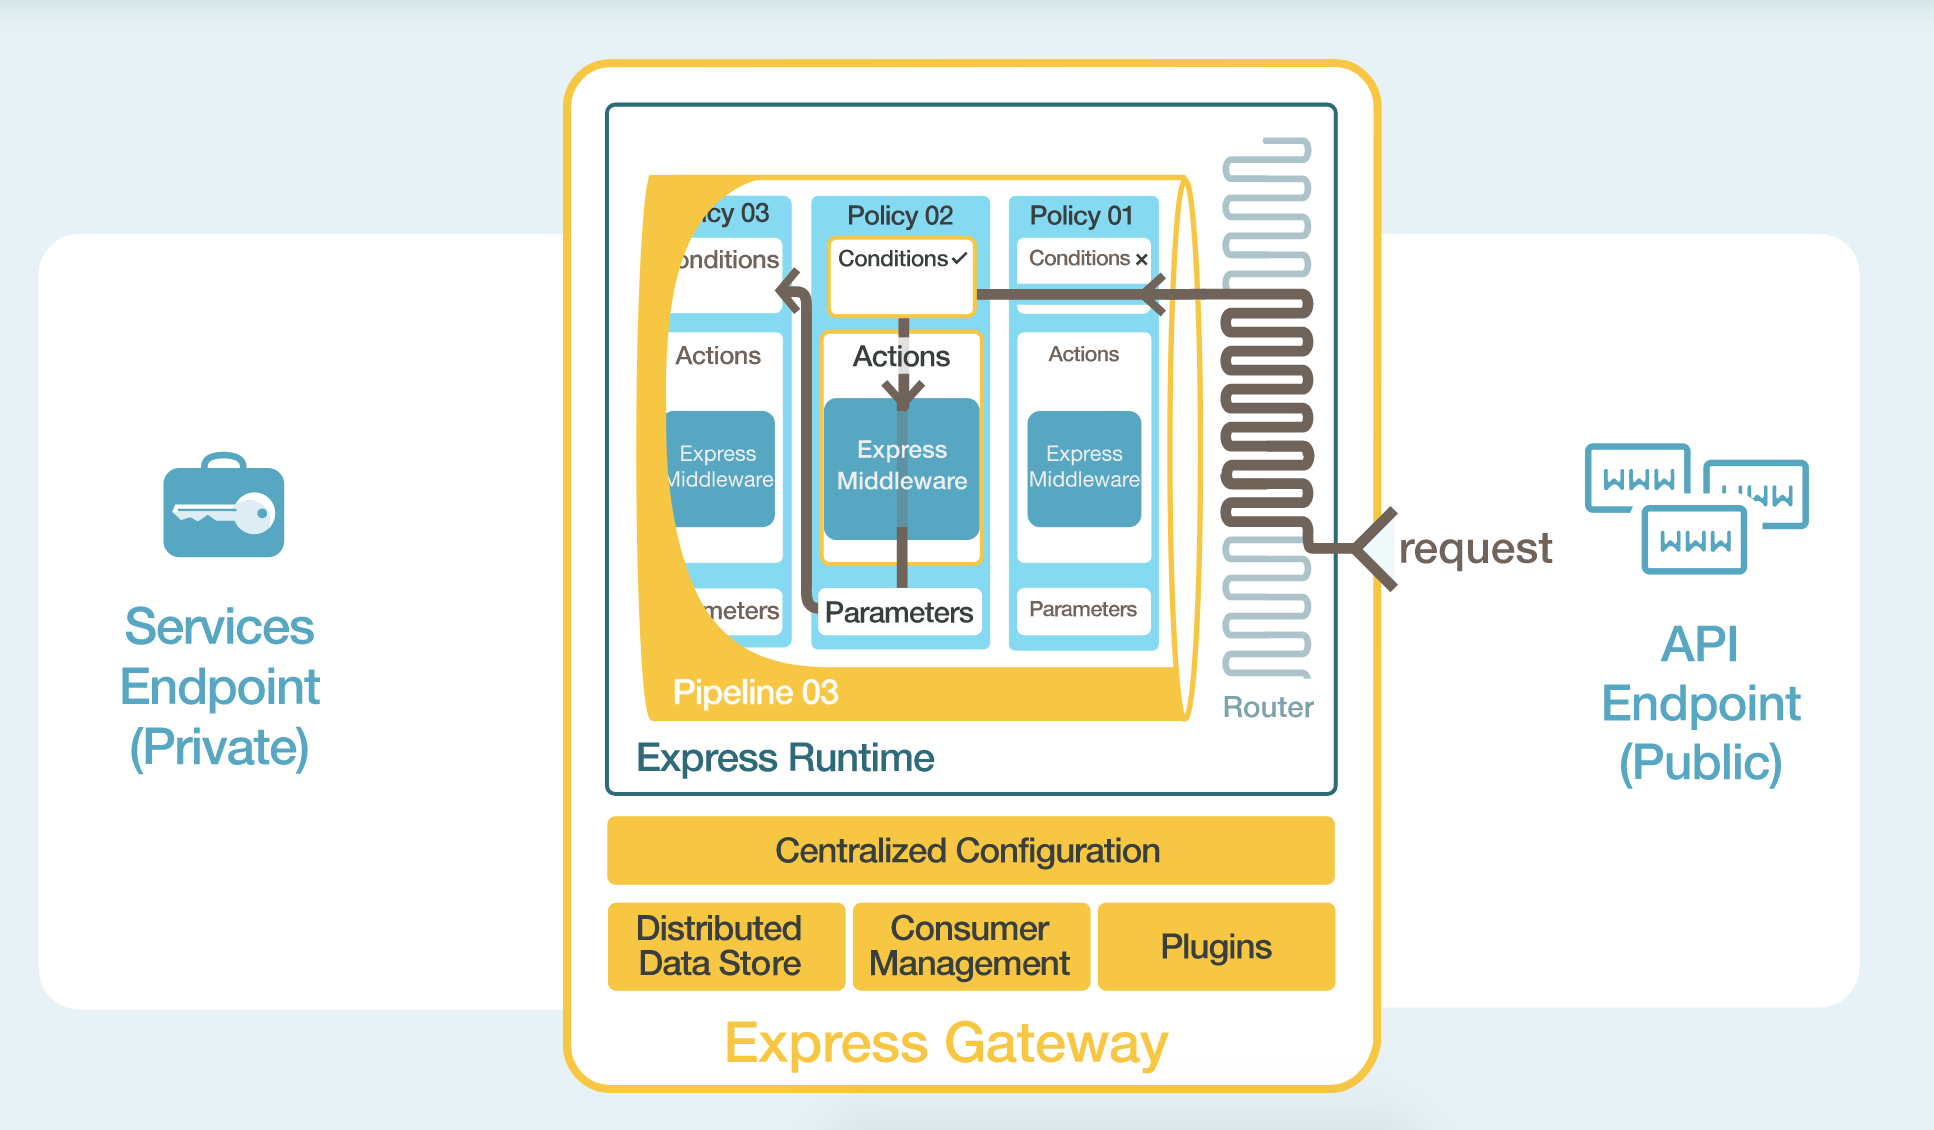
Express Gateway is an API gateway that sits at the heart of any microservices architecture (regardless of what language or platform is being used), securing the different pieces and exposing them through APIs. All these magic works by using Node.js, ExpressJS, and Express middleware.
Express Gateway centralizes all the application configuration for the API use case into one YAML (or JSON) file. Within the YAML file there is an easy to understand description of what is configured and how.
Express Gateway entities, like policies, pipelines, conditions, and actions wrap around Express middleware to make it dynamic. Any Express middleware can be plugged into Express Gateway to take advantage of its dynamic capabilities. It also features a hot-reload mechanism so you can change its configuration without having to restart the gateway at all.
Writing a Plugin for Express Gateway
Express Gateway comes with a plugin framework used to extend the Express Gateway core.
The plugin framework enables anyone to take Express middleware and integrate them into Express Gateway as plugins. Express Gateway provides a declarative way to take advantage of Express middleware to be driven centrally and executed dynamically.
We're going to leverage such framework in order to build a plugin that'll hook in our HTTP responses and collect the information we need.
Scaffold a Plugin
A plugin is nothing more than a JavaScript object that you export. It's shape is described in detail in the documentation
module.exports = {
  init: function (pluginContext) {

  },
}
In our case, we will create a plugin that:
- Exposes a policy that will hook in the response, collecting information in Prometheus format.
- Extend the Admin API to expose an additional endpoint that will serve all the collected information.
What Metrics Are We Going to Collect?
There are a lot of ways to slice and dice metrics. They may vary according to your needs.
In this example, we will label all the responses that are on the way to the client according to:
- Success/Failed responses (discerned on the status code).
- The status code itself.
- The consumer id (if the request is authenticated).
- The API Endpoint that triggered the Gateway.
What format do we expose the metrics?
To leverage the existing tooling around, we will expose the collected metrics in the Prometheus Text Based Wire Format. In this way, we can leverage the tools that are already on the space to push and visualize the information, such as Grafana.
const metrics = require('prom-client');

const statusCodeCounter = new metrics.Counter({
  name: 'status_codes',
  help: 'status_code_counter',
  labelNames: ['type', 'status_code', 'consumer', 'apiendpoint']
});

module.exports = {
  version: '1.0.0',
  policies: ['metrics'],
  init: (pluginContext) => {
    pluginContext.registerAdminRoute((app) => {
      app.get(pluginContext.settings.endpointName, (req, res) => {
        if (req.accepts(metrics.register.contentType)) {
          res.contentType(metrics.register.contentType);
          return res.send(metrics.register.metrics());
        }

        return res.json(metrics.register.getMetricsAsJSON());
      });
    });

    pluginContext.registerPolicy({
      name: 'metrics',
      policy: ({ consumerIdHeaderName }) => (req, res, next) => {
        res.once('finish', () => {
          const apiEndpoint = req.egContext.apiEndpoint.apiEndpointName;
          const consumerHeader = req.header(consumerIdHeaderName) || 'anonymous';
          const statusCode = res.statusCode.toString();
          const responseType = res.statusCode >= 200 && res.statusCode < 300 ? 'SUCCESS' : 'FAILED';
          statusCodeCounter.labels(responseType, statusCode, consumerHeader, apiEndpoint).inc();
        });

        next();
      }
    });
  }
};
Let's go through the code and see the relevant parts:
const statusCodeCounter = new metrics.Counter({
  name: 'status_codes',
  help: 'status_code_counter',
  labelNames: ['type', 'status_code', 'consumer', 'apiendpoint']
});
Here we're declaring a new Prometheus Counter called status_code that will track all the responses and categorize
them based on the declared labels (['type', 'status_code', 'consumer', 'apiendpoint']):
pluginContext.registerAdminRoute((app) => {
  app.get(pluginContext.settings.endpointName, (req, res) => {
    if (req.accepts(metrics.register.contentType)) {
      res.contentType(metrics.register.contentType);
      return res.send(metrics.register.metrics());
    }

    return res.json(metrics.register.getMetricsAsJSON());
  });
});
This part of code is registering a new route that will expose all the collected metrics. According to the Accept header, we're either returning the data in Prometheus format as JSON or in text format. The external tool collecting the data (such as InfluxDB or a Prometheus server) will query this endpoint periodically to grab the latest updates.
Note: Prometheus also supports data pushing instead of polling it periodically. If you go in this way, you can avoid to expose an endpoint at all. Based on your requirements (such as security) you may opt for this other option.
pluginContext.registerPolicy({
  name: 'metrics',
  policy: ({ consumerIdHeaderName }) => (req, res, next) => {
    res.once('finish', () => {
      const apiEndpoint = req.egContext.apiEndpoint.apiEndpointName;
      const consumerHeader = req.header(consumerIdHeaderName) || 'anonymous';
      const statusCode = res.statusCode.toString();
      const responseType = res.statusCode >= 200 && res.statusCode < 300 ? 'SUCCESS' : 'FAILED';
      statusCodeCounter.labels(responseType, statusCode, consumerHeader, apiEndpoint).inc();
    });

    next();
  }
});
Then, we export a new policy that will register an event handler once the response is terminated. Here we can now inspect all the response as well as request details that will populate our labels.
Note: egContext is an Express Gateway specific object that contains additional information on the request that's being handled.
Put it in production
We have our plugin ready to be used. Now we have to install it in our Gateway and enabled it.
Express Gateway plugins are nothing more than NPM packages, so we can simply publish our package to the registry and then install it using the command line.
For this tutorial, I've already published a plugin called express-gateway-prometheus-metrics-example with the exact same code we saw above. Hence, we can install the plugin directly by simply typing eg plugins install express-gateway-prometheus-metrics-example
Note: Express Gateway can also load plugins inline. This is useful when you want to test them before publishing them. In this case, you could point the package property to our index.js file.
Now let's modify our gateway.config and configure a policy that will take advantage of such policy:
http:
  port: 8080
admin:
  port: 9876
apiEndpoints:
  api:
    host: '*'
serviceEndpoints:
  httpbin:
    url: 'http://httpbin.org'
policies:
  - proxy
  - metrics
pipelines:
  - name: basic
    apiEndpoints:
      - api
    policies:
      - metrics:
      - proxy:
          - action:
              serviceEndpoint: httpbin
              changeOrigin: true
See it live
Let's spin up the gateway and throw some requests to it:
$ ab -n 20 http://localhost:8080/
Once the command is terminated, we can now query our metrics endpoint to see what happened with such requests:
$ curl http://localhost:9876/metrics
# HELP status_codes status_code_counter
# TYPE status_codes counter
status_codes{type="FAILED",status_code="502",consumer="anonymous",apiendpoint="api"} 15
status_codes{type="SUCCESS",status_code="200",consumer="anonymous",apiendpoint="api"} 5
You can see we received back the Prometheus metrics with all the data we collected.
Byproduct — Use JSON Schema to validate your parameters
Express Gateway relies on JSON Schemas to make sure all the configurations that goes in its funnel it's correct.
You can leverage the same mechanism to specify the required parameters, good defaults and validation rules for your plugin.
In our case, for instance, it's pretty clear that the Admin API path where the metrics will be exposed is mandatory; also we might want to configure the header where the consumer id information is stored.
With these two requirements in mind, we can write something like this:
module.exports = {
  version: '1.0.0',
  policies: ['metrics'],
  schema: {
    $id: 'http://express-gateway.io/plugins/metrics.json',
    type: 'object',
    properties: {
      endpointName: {
        type: 'string',
        default: '/metrics'
      }
    }, required: ['endpointName']
  },
  init: function (pluginContext) {
    pluginContext.registerAdminRoute((app) => {
      // admin route code
    });

    pluginContext.registerPolicy({
      name: 'metrics',
      schema: {
        $id: 'http://express-gateway.io/policies/metrics.json',
        type: 'object',
        properties: {
          consumerIdHeaderName: {
            type: 'string',
            default: 'eg-consumer-id'
          }
        }, required: ['consumerIdHeaderName']
      },
      policy: ({ consumerIdHeaderName }) => (req, res, next) => {
        // policy code
      }
    });
  }
};
Thanks to this small addition, the gateway will validate the provided parameters against the schema and will refuse to load the plugin if the validation does not pass.
Aside: Configure Express Gateway to use Auth0 Identity Management
Express Gateway and Auth0 play very well together when it comes to security.
Let's now configure Auth0 to work as our user management system.
With Auth0, we only have to write a few lines of code to get solid identity management solution, single sign-on, support for social identity providers (like Facebook, GitHub, Twitter, etc.), and support for enterprise identity providers (Active Directory, LDAP, SAML, custom, etc.).
If you don't already have an Auth0 account, sign up for a free one now.
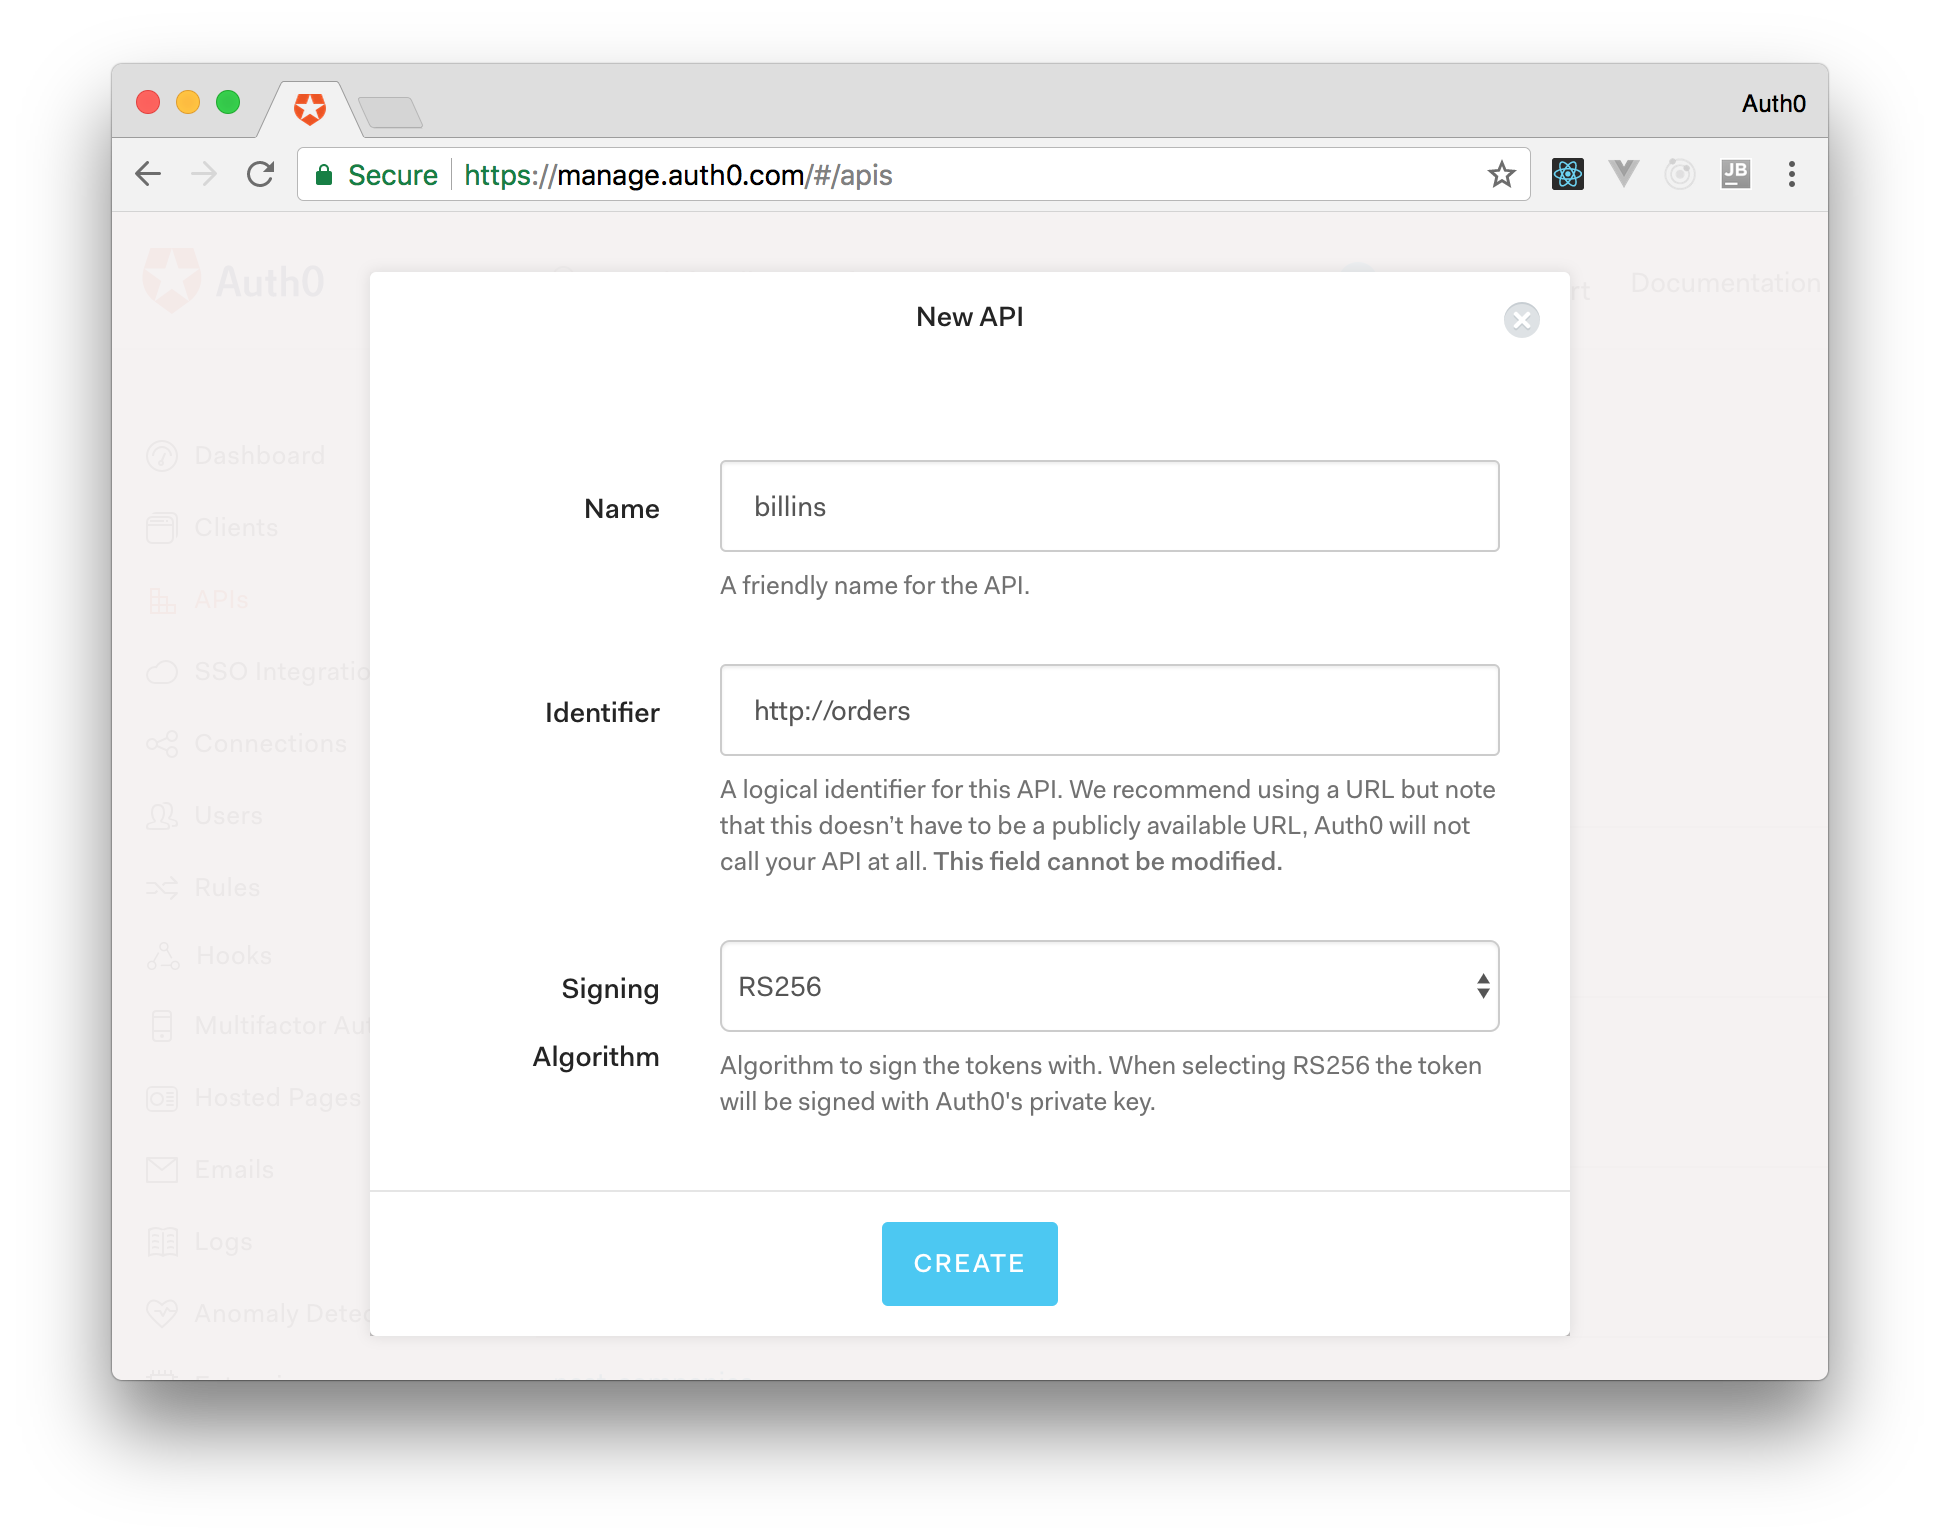
From the Auth0 management dashboard, click on the APIs menu item, and then on the Create API button. You will need to give your API a name and an identifier. The name can be anything you choose, so make it as descriptive as you want. The identifier will be used to identify your API, this field cannot be changed once set.
For our example, I'll name the API billings and identify it as http://orders. I'll also leave the signing algorithm as RS256 and click on the Create API button.

Now, point your browser to https://yourAPI.auth0.com/pem (where yourAPI is the Auth0 domain that you chose when creating your account) and download the public key file.
This is the key that we will use to verify that the JSON Web Tokens (JWTs) issued by Auth0 are valid. Save it as pubKey.pem and place it in the same directory specified in secretOrPublicKeyFile parameter of the jwt policy (that is, in a directory called key in the project root).
The API Gateway has now been configured correctly to handle the scenarios.
Enable JWT verification in Express Gateway
Express Gateway can be configured to validate tokens provided by Auth0 by installing the JWT policy in any of the pipelines.
policies:
  # Other policies
  - jwt:
      - action:
          secretOrPublicKeyFile: ./key/pubKey.pem
          checkCredentialExistence: false
Test Drive
Start the gateway using npm start in the project root. Once running, let's try to issue a couple of requests to it:
$ curl http://localhost:8080
$ Unauthorized
You can see that the first request has been denied with Unauthorized status. That's because we didn't provide any JWT with the request, so it didn't go through.
Now grab any HTTP client and let's configure it to start an OAuth 2.0 authorization process against Auth0. We can grab all the necessary parameters going on Applications -> Billings (Test Application) -> Settings
In my case, I am going to use curl, but you can use the client you prefer:
curl --request POST \
  --url https://{AUTH0_DOMAIN}.auth0.com/oauth/token \
  --header 'content-type: application/json' \
  --data '{
    "client_id":"{AUTH0_CLIENT_ID}",
    "client_secret":"{AUTH0_CLIENT_SECRET}",
    "audience":"http://orders",
    "grant_type":"client_credentials"
}'
Note: Make sure to replace all the placeholders with real values provided by Auth0.
Now, by simply copying the access_token attribute from the response, we will be able to communicate with the API through Express Gateway (you can verify the returned token by using JWT.io). This is the token to be used in order to access the protected resource. So, just try to issue requests making sure that the token is now sent as a Bearer Authorization to the endpoint. The response should hopefully be 200.
export JWT="ey...the-rest-of-the-token"
curl -H "Authorization: Bearer "$JWT http://localhost:8080
We made it! Now all the request that go in any pipelines using the JWT policy will be checked and verified.
Conclusions
Metrics are hard. In a Microservices context, it's even harder. In this installment we discovered how to leverage the shared middleware (our API gateway) to collect data without having to modify the services' code at all, and have a centralized way to push and display these.
“Metrics are hard. In a Microservices context, it's even harder. See how Express Gateway and Auth0 can help you with that”
Tweet This
About the author

Vincenzo Chianese
API Architect

