

TL;DR: Charts create some of the most catchy sections on any business applications. A chart that updates in real time is even more catchy/useful and adds huge value to users. Here, you will see how to create real-time charts using Angular, D3, and Socket.IO. You can find the final code produced throughout this article in this GitHub repository.
Introduction
With the evolution of the web, the needs of users are also increasing. The capabilities of the web in the present era can be used to build very rich interfaces. The interfaces may include widgets in the dashboards, huge tables with incrementally loading data, different types of charts and anything that you can think of. Thanks to the technologies like WebSockets, users want to see the UI updated as early as possible. This is a good problem for you to know how to deal with.
In this article, you will build a virtual market application that shows a D3 multi-line chart. That chart will consume data from a Node.js backend consisting of an Express API and a SocketIO instance to get this data in real time.
“Learn how to create real-time @Angular apps with D3 and Socket.IO”
Tweet This
Creating a Virtual Market Server
The demo app you are going to build consists of two parts. One is a Node.js server that provides market data and the other is an Angular application consuming this data. As stated, the server will consist of an Express API and a SocketIO endpoint to serve the data continuously.
So, to create this server and this Angular application, you will a directory to hold the source code. As such, create a new directory called virtual-market and, inside this folder, create a sub-directory called server. In a terminal (e.g. Bash or PowerShell), you can move into the server directory and run the following command:
# move into the server directory
cd virtual-market/server/

# initialize it as an NPM project
npm init -y
This command will generate the package.json file with some default properties. After initializing this directory as an NPM project, run the following command to install some dependencies of the server:
npm install express moment socket.io
Once they are installed, you can start building your server.
Building the Express API
First, create a new file called market.js inside the server directory. This file will be used as a utility. It will contain the data of a virtual market and it will contain a method to update the data. For now, you will add the data alone and the method will be added while creating the Socket.IO endpoint. So, add the following code to this file:
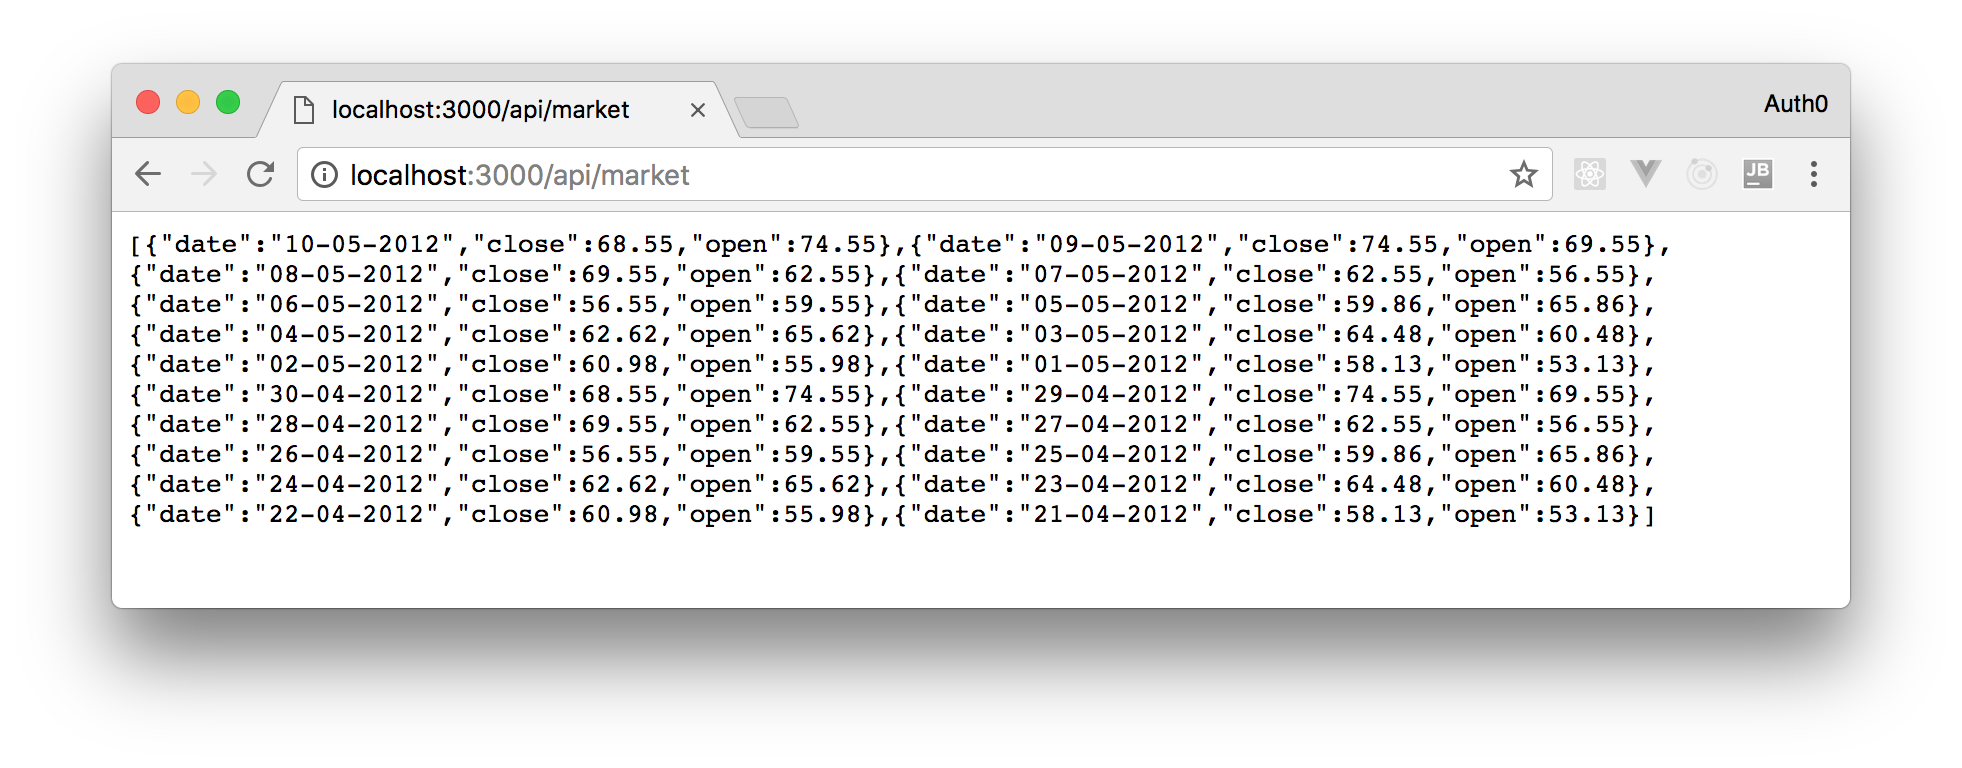
const marketPositions = [
  {"date": "10-05-2012", "close": 68.55, "open": 74.55},
  {"date": "09-05-2012", "close": 74.55, "open": 69.55},
  {"date": "08-05-2012", "close": 69.55, "open": 62.55},
  {"date": "07-05-2012", "close": 62.55, "open": 56.55},
  {"date": "06-05-2012", "close": 56.55, "open": 59.55},
  {"date": "05-05-2012", "close": 59.86, "open": 65.86},
  {"date": "04-05-2012", "close": 62.62, "open": 65.62},
  {"date": "03-05-2012", "close": 64.48, "open": 60.48},
  {"date": "02-05-2012", "close": 60.98, "open": 55.98},
  {"date": "01-05-2012", "close": 58.13, "open": 53.13},
  {"date": "30-04-2012", "close": 68.55, "open": 74.55},
  {"date": "29-04-2012", "close": 74.55, "open": 69.55},
  {"date": "28-04-2012", "close": 69.55, "open": 62.55},
  {"date": "27-04-2012", "close": 62.55, "open": 56.55},
  {"date": "26-04-2012", "close": 56.55, "open": 59.55},
  {"date": "25-04-2012", "close": 59.86, "open": 65.86},
  {"date": "24-04-2012", "close": 62.62, "open": 65.62},
  {"date": "23-04-2012", "close": 64.48, "open": 60.48},
  {"date": "22-04-2012", "close": 60.98, "open": 55.98},
  {"date": "21-04-2012", "close": 58.13, "open": 53.13}
];

module.exports = {
  marketPositions,
};
Now, add another file and name it index.js. This file will do all the Node.js work required. For now, you will add the code to create an Express REST API to serve the data. So, add the following code to the file index.js:
const app = require('express')();
const http = require('http').Server(app);
const market = require('./market');

const port = 3000;

app.use((req, res, next) => {
  res.header('Access-Control-Allow-Origin', '*');
  res.header('Access-Control-Allow-Headers', 'Origin, X-Requested-With, Content-Type, Accept');
  next();
});

app.get('/api/market', (req, res) => {
  res.send(market.marketPositions);
});

http.listen(port, () => {
  console.log(`Listening on *:${port}`);
});
After saving this file, you can check if everything is going well. Run the following command to start your Express REST API:
# from the server directory, run the server
node index.js
As this command starts your Node.js server on port 3000, you can visit the http://localhost:3000/api/market URL to see the market updates on the last few days.
Adding Socket.IO to Serve Data in Real Time
To show a real-time chart, you will need to simulate a real-time market data by updating it every 5 seconds. For this, you will add a new method to the market.js file. This method will be called from a Socket.IO endpoint that you will add to your index.js file. So, open the file market.js and add the following code to it:
const moment = require('moment');

// const marketPositions ...

let counter = 0;

function updateMarket() {
  const diff = Math.floor(Math.random() * 1000) / 100;
  const lastDay = moment(marketPositions[0].date, 'DD-MM-YYYY').add(1, 'days');
  let open;
  let close;

  if (counter % 2 === 0) {
    open = marketPositions[0].open + diff;
    close = marketPositions[0].close + diff;
  } else {
    open = Math.abs(marketPositions[0].open - diff);
    close = Math.abs(marketPositions[0].close - diff);
  }

  marketPositions.unshift({
    date: lastDay.format('DD-MM-YYYY'),
    open,
    close
  });
  counter++;
}

module.exports = {
  marketPositions,
  updateMarket,
};
The updateMarket method generates a random number every time it is called and adds it to (or subtracts it from) the last market value to generate some randomness in the figures. Then, it adds this entry to the marketPositions array.
Now, open the index.js file, so you can create a Socket.IO connection to it. This connection will call the updateMarket method after every 5 seconds to update the market data and will emit an update on the Socket.IO endpoint to update the latest data for all listeners. In this file, make the following changes:
// ... other import statements ...
const io = require('socket.io')(http);

// ... app.use and app.get ...

setInterval(function () {
  market.updateMarket();
  io.sockets.emit('market', market.marketPositions[0]);
}, 5000);

io.on('connection', function (socket) {
  console.log('a user connected');
});

// http.listen(3000, ...
With these changes in place, you can start building the Angular client to use this.
Building the Angular Application
To generate your Angular application, you can use Angular CLI. There are two ways to do it. One is to install a local copy of the CLI globally in your machine and the other is to use a tool that comes with NPM that is called npx. Using npx is better because it avoids the need to install the package locally and because you always get the latest version. If you want to use npx, make sure that you have npm 5.2 or above installed.
Then, go back to the main directory of your whole project (i.e. the virtual-market directory) and run the following command to generate the Angular project:
npx @angular/cli new angular-d3-chart
Once the project is generated, you need to install both the D3 and Socket.IO NPM libraries. So, move to the angular-d3-chart directory and run the following command to install these libraries:
npm install d3 socket.io-client
As you will use these libraries with TypeScript, it is good to have their typings installed. So, run the following command to install the typings:
npm i @types/d3 @types/socket.io-client -D
Now that the setup process is done, you can run the application to see if everything is fine:
# from the angular-d3-chart directory
npm start
To see the default Angular application, just point your browser to the http://localhost:4200 URL.
Building a Component to Display the D3 Chart
Now that your Angular application setup is ready, you can start writing its code. First, you will add a component to display the multi-line D3 chart. Second, you will create a service to fetch the data. For now, this service will consume static data from the REST API then, in no time, you will add real-time capabilities to your app.
So, run the following command to add a file for this service:
npx ng generate service market-status
To consume the REST APIs, you need to use the HttpClient service from the HttpClientModule module. This module has to be imported into the application's module for this. As such, open the app.module.ts file and replace its code with this:
import {BrowserModule} from '@angular/platform-browser';
import {NgModule} from '@angular/core';
import {HttpClientModule} from '@angular/common/http';

import {AppComponent} from './app.component';

@NgModule({
  declarations: [
    AppComponent
  ],
  imports: [
    BrowserModule,
    HttpClientModule
  ],
  providers: [],
  bootstrap: [AppComponent]
})
export class AppModule {}
As you can see, the new version of this file does nothing besides adding the HttpClientModule to the imports section of the AppModule module.
Now, open the market-status.service.ts file and add the following code to it:
import {Injectable} from '@angular/core';
import {HttpClient} from '@angular/common/http';

import {MarketPrice} from './market-price';

@Injectable({
  providedIn: 'root'
})
export class MarketStatusService {

  private baseUrl =  'http://localhost:3000';
  constructor(private httpClient: HttpClient) { }

  getInitialMarketStatus() {
    return this.httpClient.get<MarketPrice[]>(`${this.baseUrl}/api/market`);
  }
}
This service uses the MarketPrice class to structure the data received from your backend API (baseUrl = 'http://localhost:3000'). To add this class to your project, create a new file named market-price.ts in the app folder and add the following code to it:
export  class MarketPrice {
  open: number;
  close: number;
  date: string | Date;
}
Now, add a new component to the application, so you can show the multi-line D3 chart. The following command adds this component:
npx ng g c market-chart
Then, open the market-chart.component.html file and replace its default content with this:
<div #chart></div>
The D3 chart will be rendered inside this <div #chart> element. As you can see, you created a local reference for the div element (#chart). You will use this reference in your component class while configuring D3.
This component will not use the MarketStatusService to fetch data. Instead, it will accept the data as input. The goal of this approach is to make the market-chart component reusable. For this, the component will have an Input field and the value to this field will be passed from the app-root component. The component will use the ngOnChanges lifecycle hook to render the chart whenever there is a change in the data. It will also use the OnPush change detection strategy to ensure that the chart is re-rendered only when the input changes.
So, open the file market-chart.component.ts and add the following code to it:
import {ChangeDetectionStrategy, Component, ElementRef, Input, OnChanges, ViewChild} from '@angular/core';
import * as d3 from 'd3';

import {MarketPrice} from '../market-price';

@Component({
  selector: 'app-market-chart',
  templateUrl: './market-chart.component.html',
  styleUrls: ['./market-chart.component.css'],
  changeDetection: ChangeDetectionStrategy.OnPush
})
export class MarketChartComponent implements OnChanges {
  @ViewChild('chart')
  chartElement: ElementRef;

  parseDate = d3.timeParse('%d-%m-%Y');

  @Input()
  marketStatus: MarketPrice[];

  private svgElement: HTMLElement;
  private chartProps: any;

  constructor() { }

  ngOnChanges() { }

  formatDate() {
    this.marketStatus.forEach(ms => {
      if (typeof ms.date === 'string') {
        ms.date = this.parseDate(ms.date);
      }
    });
  }
}
Now, the MarketChartComponent class has everything required to render the chart. In addition to the local reference for the div (chartElement) and the lifecycle hook, the class has a few fields that will be used while rendering the chart. The parseDate method converts string values to Date objects and the private fields svgElement and chartProps will be used to hold the reference of the SVG element and the properties of the chart respectively. These fields will be quite useful to re-render the chart.
Now, the most complex part of the tutorial. Add the following method to the MarketChartComponent class:
 buildChart() {
  this.chartProps = {};
  this.formatDate();

  // Set the dimensions of the canvas / graph
  var margin = { top: 30, right: 20, bottom: 30, left: 50 },
    width = 600 - margin.left - margin.right,
    height = 270 - margin.top - margin.bottom;

  // Set the ranges
  this.chartProps.x = d3.scaleTime().range([0, width]);
  this.chartProps.y = d3.scaleLinear().range([height, 0]);

  // Define the axes
  var xAxis = d3.axisBottom(this.chartProps.x);
  var yAxis = d3.axisLeft(this.chartProps.y).ticks(5);

  let _this = this;

  // Define the line
  var valueline = d3.line<MarketPrice>()
    .x(function (d) {
      if (d.date instanceof Date) {
        return _this.chartProps.x(d.date.getTime());
      }
    })
    .y(function (d) { console.log('Close market'); return _this.chartProps.y(d.close); });

  // Define the line
  var valueline2 = d3.line<MarketPrice>()
    .x(function (d) {
      if (d.date instanceof Date) {
        return _this.chartProps.x(d.date.getTime());
      }
    })
    .y(function (d) { console.log('Open market'); return _this.chartProps.y(d.open); });

  var svg = d3.select(this.chartElement.nativeElement)
    .append('svg')
    .attr('width', width + margin.left + margin.right)
    .attr('height', height + margin.top + margin.bottom)
    .append('g')
    .attr('transform', `translate(${margin.left},${margin.top})`);

  // Scale the range of the data
  this.chartProps.x.domain(
    d3.extent(_this.marketStatus, function (d) {
      if (d.date instanceof Date)
        return (d.date as Date).getTime();
    }));
  this.chartProps.y.domain([0, d3.max(this.marketStatus, function (d) {
    return Math.max(d.close, d.open);
  })]);

  // Add the valueline2 path.
  svg.append('path')
    .attr('class', 'line line2')
    .style('stroke', 'green')
    .style('fill', 'none')
    .attr('d', valueline2(_this.marketStatus));

  // Add the valueline path.
  svg.append('path')
    .attr('class', 'line line1')
    .style('stroke', 'black')
    .style('fill', 'none')
    .attr('d', valueline(_this.marketStatus));


  // Add the X Axis
  svg.append('g')
    .attr('class', 'x axis')
    .attr('transform', `translate(0,${height})`)
    .call(xAxis);

  // Add the Y Axis
  svg.append('g')
    .attr('class', 'y axis')
    .call(yAxis);

  // Setting the required objects in chartProps so they could be used to update the chart
  this.chartProps.svg = svg;
  this.chartProps.valueline = valueline;
  this.chartProps.valueline2 = valueline2;
  this.chartProps.xAxis = xAxis;
  this.chartProps.yAxis = yAxis;
}
Refer to the comments added before every section in the above method to understand what the code is doing. Also, if you have any specific doubt, just leave a comment.
Now, you will have to change the ngOnChanges function (still in your MarketChartComponent class) to call this method:
ngOnChanges() {
  if (this.marketStatus) {
    this.buildChart();
  }
}
Now, you need to insert this component in the app-root component to see the chart. So, open the app.component.html file and replace its content with:
<app-market-chart [marketStatus]="marketStatusToPlot"></app-market-chart>
Then, you have to replace the content of the app.component.ts file with the following code:
import {Component} from '@angular/core';
import {MarketStatusService} from './market-status.service';
import {Observable} from 'rxjs';
import {MarketPrice} from './market-price';

@Component({
  selector: 'app-root',
  templateUrl: './app.component.html',
  styleUrls: ['./app.component.css']
})
export class AppComponent {
  title = 'app';
  marketStatus: MarketPrice[];
  marketStatusToPlot: MarketPrice[];

  set MarketStatus(status: MarketPrice[]) {
    this.marketStatus = status;
    this.marketStatusToPlot = this.marketStatus.slice(0, 20);
  }

  constructor(private marketStatusSvc: MarketStatusService) {

    this.marketStatusSvc.getInitialMarketStatus()
      .subscribe(prices => {
        this.MarketStatus = prices;
      });
  }
}
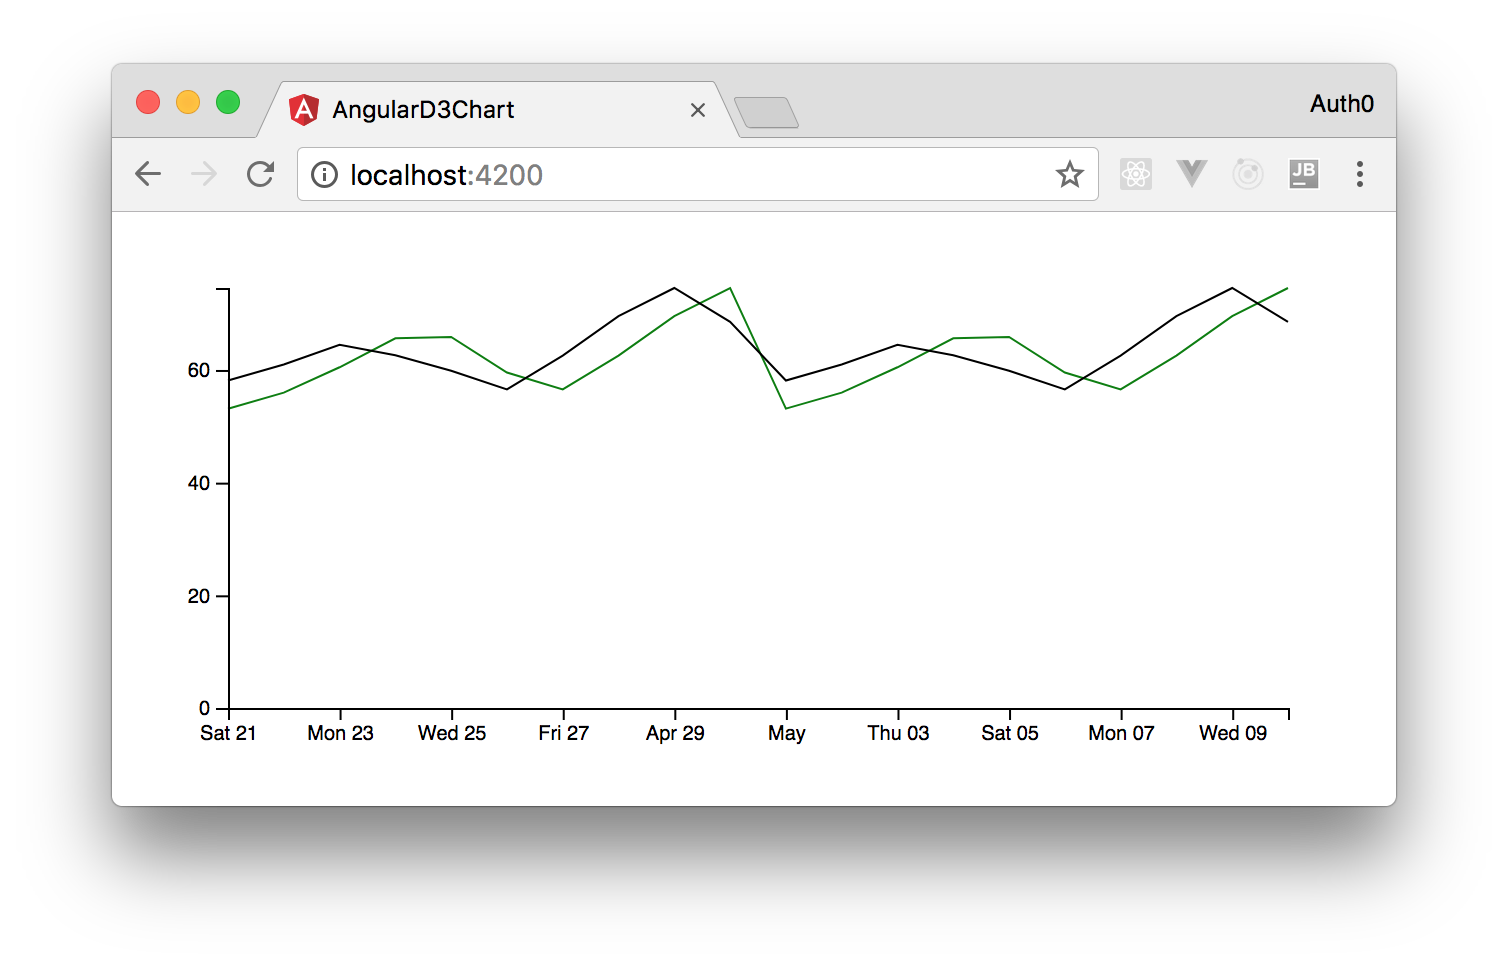
Save these changes and run the application using the ng serve command (or npm start). Now, head to the http://localhost:4200/ URL and you will see a page with a chart similar to the following image:
Adding Real-Time Capabilities to the D3 Chart
Now that you have the chart rendered on the page, you can make it receive the market updates from Socket.IO to make it real-time. To receive these updates, you need to add a listener to the Socket.IO endpoint in the market-status.service.ts file. So, open this file and replace its code with:
import {Injectable} from '@angular/core';
import {HttpClient} from '@angular/common/http';

import {MarketPrice} from './market-price';
import { Subject, from } from  'rxjs';
import * as socketio from 'socket.io-client';

@Injectable({
  providedIn: 'root'
})
export class MarketStatusService {

  private baseUrl =  'http://localhost:3000';
  constructor(private httpClient: HttpClient) { }

  getInitialMarketStatus() {
    return this.httpClient.get<MarketPrice[]>(`${this.baseUrl}/api/market`);
  }

  getUpdates() {
    let socket = socketio(this.baseUrl);
    let marketSub = new Subject<MarketPrice>();
    let marketSubObservable = from(marketSub);

    socket.on('market', (marketStatus: MarketPrice) => {
      marketSub.next(marketStatus);
    });

    return marketSubObservable;
  }
}
The new method, getUpdates, does three important things:
- it creates a manager for the Socket.IO endpoint at the given URL;
- it creates a RxJS
Subjectand gets anObservablefrom this subject. This observable is returned from this method so consumers can listen to the updates; - The call to the
onmethod on the Socket.IO manager adds a listener to themarketevent. The callback passed to this method is called whenever the Socket.IO endpoint publishes something new.
Now, you have to make the AppComponent class consume the getUpdates() method. So, open the app.component.ts file and modify the constructor as shown below:
constructor(private marketStatusSvc: MarketStatusService) {
  this.marketStatusSvc.getInitialMarketStatus()
    .subscribe(prices => {
      this.MarketStatus = prices;

      let marketUpdateObservable =  this.marketStatusSvc.getUpdates();  // 1
      marketUpdateObservable.subscribe((latestStatus: MarketPrice) => {  // 2
        this.MarketStatus = [latestStatus].concat(this.marketStatus);  // 3
      });  // 4
    });
}
In the above snippet, the statements marked with the numbers are the new lines added to the constructor. Observe the statement labeled with 3. This statement creates a new array instead of updating the field marketStatus. This is done to let the consuming app-market-chart component know about the change when you have an update.
The last change you will need to do to see the chart working in real time is to make the flowing data hit the chart. To do this, open the market-chart.component.ts file and add the following method to the MarketChartComponent class:
updateChart() {
  let _this = this;
  this.formatDate();

  // Scale the range of the data again
  this.chartProps.x.domain(d3.extent(this.marketStatus, function (d) {
    if (d.date instanceof Date) {
      return d.date.getTime();
    }
  }));

  this.chartProps.y.domain([0, d3.max(this.marketStatus, function (d) { return Math.max(d.close, d.open); })]);

  // Select the section we want to apply our changes to
  this.chartProps.svg.transition();

  // Make the changes to the line chart
  this.chartProps.svg.select('.line.line1') // update the line
    .attr('d', this.chartProps.valueline(this.marketStatus));

  this.chartProps.svg.select('.line.line2') // update the line
    .attr('d', this.chartProps.valueline2(this.marketStatus));

  this.chartProps.svg.select('.x.axis') // update x axis
    .call(this.chartProps.xAxis);

  this.chartProps.svg.select('.y.axis') // update y axis
    .call(this.chartProps.yAxis);
}
The comments added in the snippet explain what you are doing in this method. Now, you have to make the ngOnChanges method call this new method. So, change the ngOnChanges() method in the MarketChartComponent class as shown below:
ngOnChanges() {
  if (this.marketStatus &&  this.chartProps) {
    this.updateChart();
  } else if (this.marketStatus) {
    this.buildChart();
  }
}
Now, if you run the application, you will see an error on the browser console saying global is not defined.
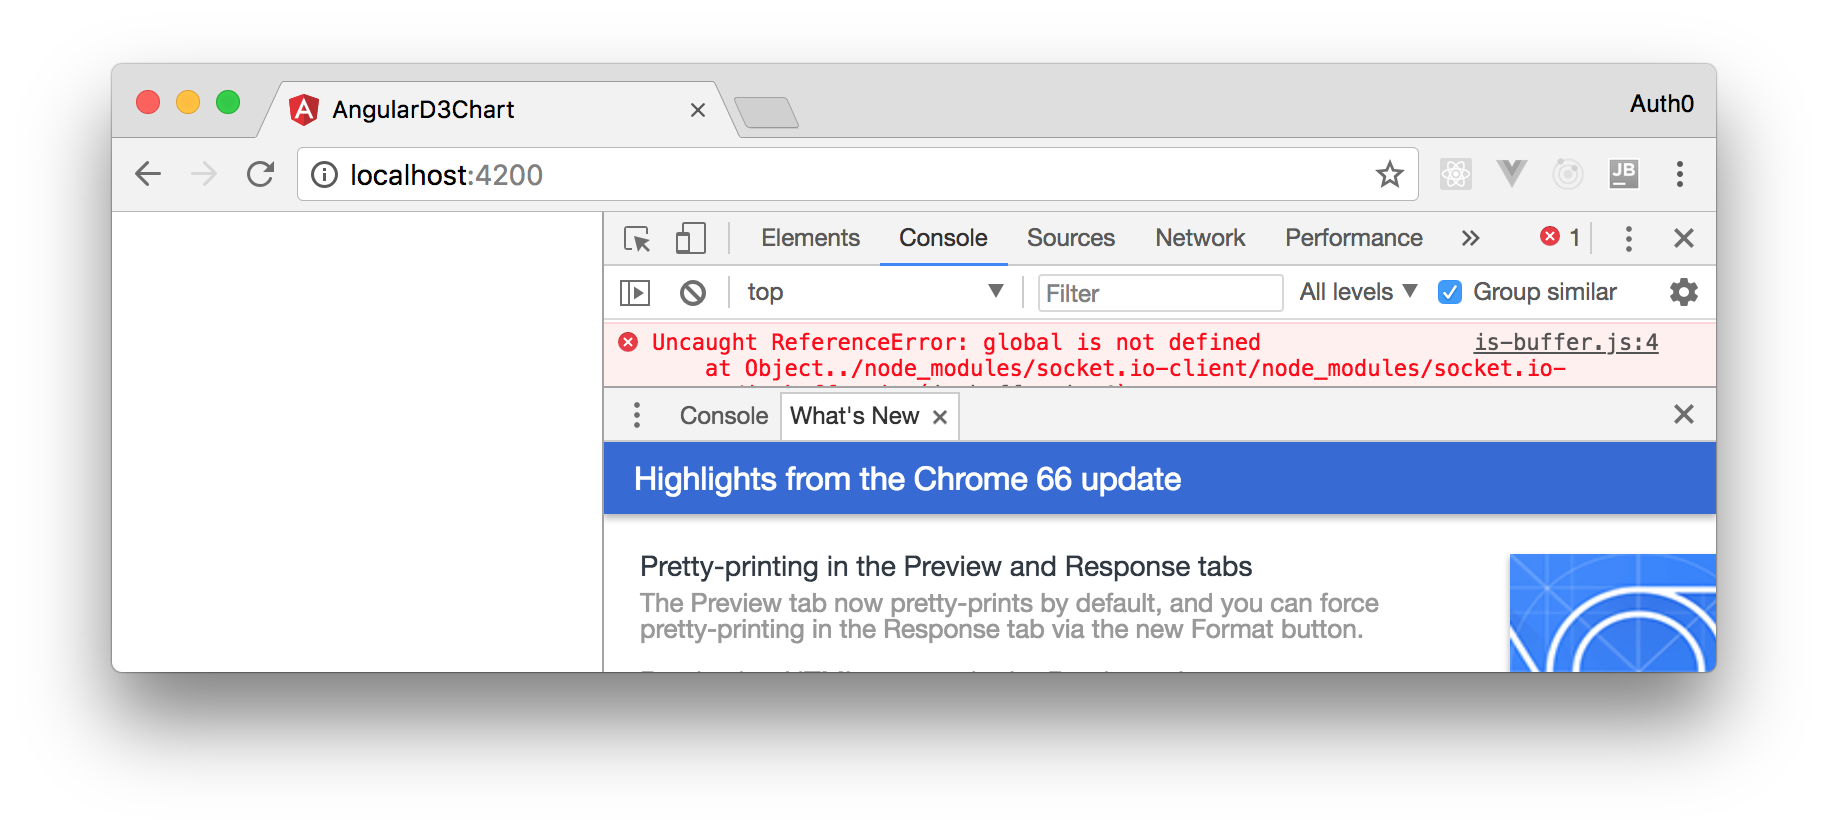
This is because Angular CLI 6 removed the global object and SocketIO uses it. To fix this problem, add the following statement to the polyfills.ts file:
(window as any).global = window;
With this, all the changes are done. Save all your files and run the applications again. You can move into the server directory in one terminal and issue node index.js to run your backend API, then move to the angular-d3-chart directory and issue npm start to run the Angular application.
Now, if you head to (http://localhost:4200)[http://localhost:4200], you will see your nice chart with real-time data flowing into it every 5 seconds.
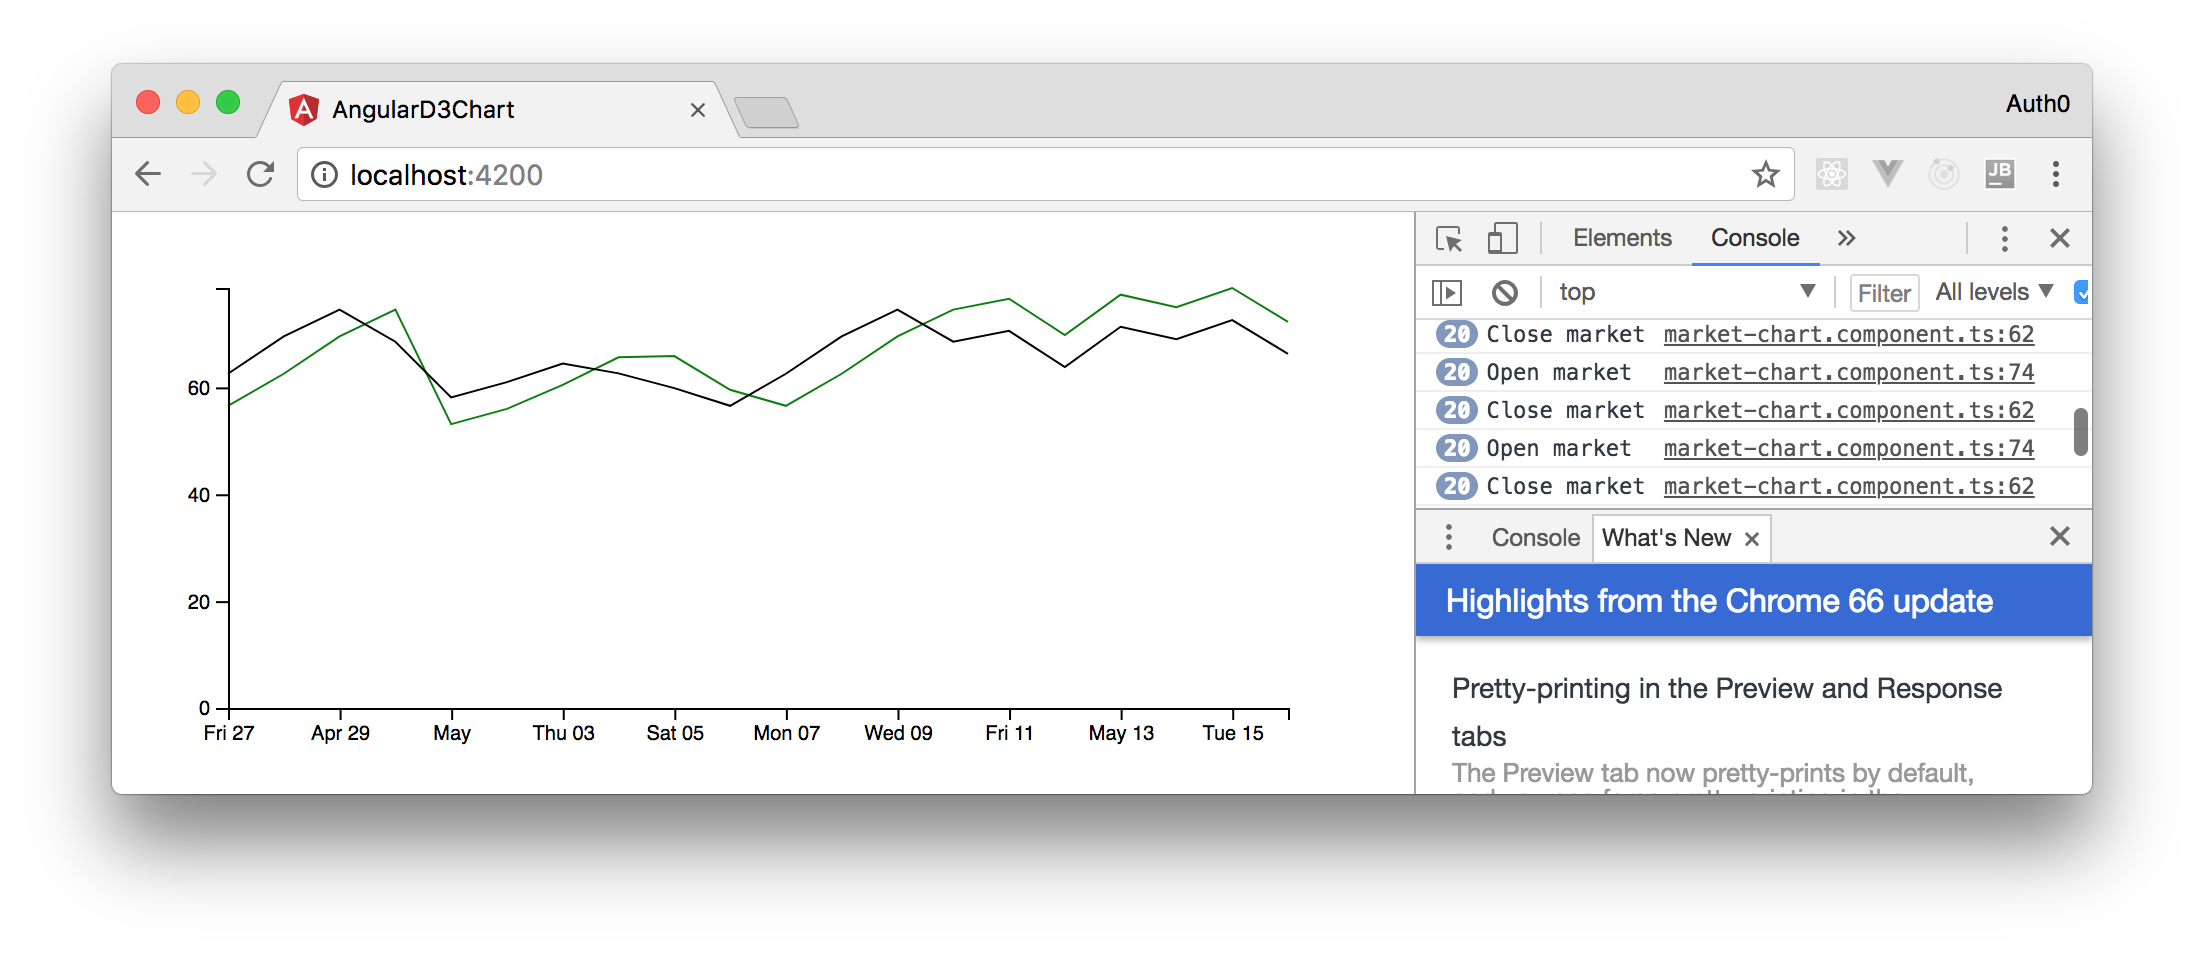
Awesome, right?
“Adding real-time capabilities to @Angular is easy with D3 and Socket.IO”
Tweet This
Aside: Authenticate an Angular App with Auth0
By integrating Auth0 in your Angular application, you will be able to manage user identities, including password resets, creating, provisioning, blocking, and deleting users. It requires just a few steps.
Set up an Auth0 application
First, sign up for a free account here. Then, set up an Auth0 application with the following steps:
- Go to your Applications section of the Auth0 Dashboard and click the "Create Application" button.
- Name your new app and select "Single Page Web Applications" as the application type.
- In the Settings for your new Auth0 app, add
http://localhost:4200to the Allowed Callback URLs, Allowed Web Origins, and Allowed Logout URLs. Click the "Save Changes" button. - If you'd like, you can set up some social connections. You can then enable them for your app in the Application options under the Connections tab. The example shown in the screenshot above uses username/password database, Facebook, Google, and Twitter.
Note: Set up your own social keys and do not leave social connections set to use Auth0 dev keys, or you will encounter issues with token renewal.
Add dependencies and configure
In the root folder of your Angular project, install the auth0-spa-js library by typing the following command in a terminal window:
npm install @auth0/auth0-spa-js
Then, edit the environment.ts file in the src/environments folder and add the CLIENT_DOMAIN and CLIENT_ID keys as follows:
// src/environments/environment.ts

export const environment = {
  production: false,
  auth: {
    CLIENT_DOMAIN: 'YOUR_DOMAIN',
    CLIENT_ID: 'YOUR_CLIENT_ID',
  },
};

export const config = {};
Replace the
YOUR_DOMAINandYOUR_CLIENT_IDplaceholders with the actual values for the domain and client id you found in your Auth0 Dashboard.
Add the authentication service
Authentication logic in your Angular application is handled with an AuthService authentication service. So, use Angular CLI to generate this new service by running the following command:
ng generate service auth
Now, open the src/app/auth.service.ts file and replace its content with the following:
//src/app/auth.service.ts

import { Injectable } from '@angular/core';
import createAuth0Client from '@auth0/auth0-spa-js';
import Auth0Client from '@auth0/auth0-spa-js/dist/typings/Auth0Client';
import {
  from,
  of,
  Observable,
  BehaviorSubject,
  combineLatest,
  throwError,
} from 'rxjs';
import { tap, catchError, concatMap, shareReplay } from 'rxjs/operators';
import { Router } from '@angular/router';
import { environment } from './../environments/environment';

@Injectable({
  providedIn: 'root',
})
export class AuthService {
  // Create an observable of Auth0 instance of client
  auth0Client$ = (from(
    createAuth0Client({
      domain: environment.auth.CLIENT_DOMAIN,
      client_id: environment.auth.CLIENT_ID,
      redirect_uri: `${window.location.origin}`,
    }),
  ) as Observable<Auth0Client>).pipe(
    shareReplay(1), // Every subscription receives the same shared value
    catchError((err) => throwError(err)),
  );
  // Define observables for SDK methods that return promises by default
  // For each Auth0 SDK method, first ensure the client instance is ready
  // concatMap: Using the client instance, call SDK method; SDK returns a promise
  // from: Convert that resulting promise into an observable
  isAuthenticated$ = this.auth0Client$.pipe(
    concatMap((client: Auth0Client) => from(client.isAuthenticated())),
    tap((res) => (this.loggedIn = res)),
  );
  handleRedirectCallback$ = this.auth0Client$.pipe(
    concatMap((client: Auth0Client) => from(client.handleRedirectCallback())),
  );
  // Create subject and public observable of user profile data
  private userProfileSubject$ = new BehaviorSubject<any>(null);
  userProfile$ = this.userProfileSubject$.asObservable();
  // Create a local property for login status
  loggedIn: boolean = null;

  constructor(private router: Router) {
    // On initial load, check authentication state with authorization server
    // Set up local auth streams if user is already authenticated
    this.localAuthSetup();
    // Handle redirect from Auth0 login
    this.handleAuthCallback();
  }

  // When calling, options can be passed if desired
  // https://auth0.github.io/auth0-spa-js/classes/auth0client.html#getuser
  getUser$(options?): Observable<any> {
    return this.auth0Client$.pipe(
      concatMap((client: Auth0Client) => from(client.getUser(options))),
      tap((user) => this.userProfileSubject$.next(user)),
    );
  }

  private localAuthSetup() {
    // This should only be called on app initialization
    // Set up local authentication streams
    const checkAuth$ = this.isAuthenticated$.pipe(
      concatMap((loggedIn: boolean) => {
        if (loggedIn) {
          // If authenticated, get user and set in app
          // NOTE: you could pass options here if needed
          return this.getUser$();
        }
        // If not authenticated, return stream that emits 'false'
        return of(loggedIn);
      }),
    );
    checkAuth$.subscribe();
  }

  login(redirectPath: string = '/') {
    // A desired redirect path can be passed to login method
    // (e.g., from a route guard)
    // Ensure Auth0 client instance exists
    this.auth0Client$.subscribe((client: Auth0Client) => {
      // Call method to log in
      client.loginWithRedirect({
        redirect_uri: `${window.location.origin}`,
        appState: { target: redirectPath },
      });
    });
  }

  private handleAuthCallback() {
    // Call when app reloads after user logs in with Auth0
    const params = window.location.search;
    if (params.includes('code=') && params.includes('state=')) {
      let targetRoute: string; // Path to redirect to after login processed
      const authComplete$ = this.handleRedirectCallback$.pipe(
        // Have client, now call method to handle auth callback redirect
        tap((cbRes) => {
          // Get and set target redirect route from callback results
          targetRoute =
            cbRes.appState && cbRes.appState.target
              ? cbRes.appState.target
              : '/';
        }),
        concatMap(() => {
          // Redirect callback complete; get user and login status
          return combineLatest([this.getUser$(), this.isAuthenticated$]);
        }),
      );
      // Subscribe to authentication completion observable
      // Response will be an array of user and login status
      authComplete$.subscribe(([user, loggedIn]) => {
        // Redirect to target route after callback processing
        this.router.navigate([targetRoute]);
      });
    }
  }

  logout() {
    // Ensure Auth0 client instance exists
    this.auth0Client$.subscribe((client: Auth0Client) => {
      // Call method to log out
      client.logout({
        client_id: environment.auth.CLIENT_ID,
        returnTo: `${window.location.origin}`,
      });
    });
  }
}
This service provides the properties and methods necessary to manage authentication across your Angular application.
Add the login and logout buttons
To add a new component that allows you to authenticate with Auth0, run the following command in a terminal window:
ng generate component login-button
Open the src/app/login-button/login-button.component.ts file and replace its content with the following:
//src/app/login-button/login-button.component.ts

import { Component, OnInit } from '@angular/core';
import { AuthService } from '../auth.service';

@Component({
  selector: 'app-login-button',
  templateUrl: './login-button.component.html',
  styleUrls: ['./login-button.component.css'],
})
export class LoginButtonComponent implements OnInit {
  constructor(public auth: AuthService) {}

  ngOnInit() {}
}
Next, define the component's UI by replacing the content of the src/app/login-button/login-button.component.html with the following markup:
<!-- src/app/login-button/login-button.component.html -->
<div>
  <button (click)="auth.login()" *ngIf="!auth.loggedIn">Log In</button>
  <button (click)="auth.logout()" *ngIf="auth.loggedIn">Log Out</button>
</div>
Finally, put the <app-login-button></app-login-button> tag within the src/app/app.component.html file, wherever you want the component to appear.
Your Angular application is ready to authenticate with Auth0!
Check out the Angular Quickstart to learn more about integrating Auth0 with Angular applications.
Conclusion
As you saw in this tutorial, the web has capabilities that allow you to build very rich applications. Your real-time chart, for example, adds a huge value to your app because there the user knows that they will have the latest data without having to refresh the page or performing any action. This kind of interactivity improves your users' experiences and will contribute to their happiness.
WDYT? Ready to add some real-time data to the web?